A Guide to Understand Analytic Geometry with Diagram
Analytic Geometry has a wide range and has its usage in physics, engineering, architecture, and many other fields of science. Considering its enormous usage, the students must develop a clear idea about the concepts of this subject. The students can use an analytic geometry diagram to learn basic and complex ideas. It is tough to make an analytic geometry diagram by hand, and the students may fail to create something of very high quality. For that, the students must use EdrawMax online tool, which can help them create a perfect analytic geometry diagram.
1. The Analytic Geometry
The analytical geometry of Cartesian geometry is based upon the coordinate system. Primarily it is related to mathematics. However, it has branched out and has become a crucial part of physics, architecture, spacecraft designing, and other disciplines. Analytic geometry can derive the position of a point on a two-dimensional plane and three-dimensional plane.
This idea of analytic geometry is rooted in the theories provided by Greek mathematician Menaechmi. There were similarities between the usage of coordinates. In modern analytic geometry, the most commonly used space is the cartesian plane. There is a horizontal X-axis, and a vertical Y-axis is a system, which forms the location point, and (x, y) denotes the locus of the same. Four quadrants represent the positive and negative values of x and y as the position of a particular point.

1.1 The Analytic Geometry Formula
- Slope formulas for two points with coordinates mentioned: P (x1, y1) and P2 (x2, y2):
- Distance between two given points A (x1, y1) and B (x2, y2):
- Vector equation:
- Parametric form:
- Point slope:
- General form:
- Equation of perpendicular bisector:
m = (y2−y1)/(x2−x1)
m= tanæ (slope of an angle)
m= v2/ v1 (slope of vector of a line)
d(A, B) = √(x2-x12+ y2 - y12
(x,y) = (x1, y1) + t. (v1, v2)
x = x1 + t.v1
y = y1 + t.v2
y -y1 = m (x-x1)
Ax+ By+ C = 0
m = - A/ B
(x -x1)2 +(y -y1)2= (x-x2) 2 +(y-y2)2
1.2 Calculus with Analytic Geometry
Calculus in itself is a vast section of mathematics and has a wide range of usage. On the other hand, analytic geometry has its place in conceptualizing different mathematical problems. Analytic geometry helps to solve calculus and simplify the subject related to calculus. Many researchers are considering this idea of solving calculus with analytic geometry. Hence, it is also getting popular as a subject in higher studies. Analytic geometry can help in solving different concepts like tangent, limits.
 Source:EdrawMax Online
2. How to Draw the Analytic Geometry Diagram?
The students must use the analytic geometry diagram while finding the distance between the points in a plain or calculate the slopes. It can help them to stay away from mistakes. It is challenging to create an analytic geometry diagram by hand, and it is time-consuming as well.
2.1 How to Create Analytic Geometry from Sketch
Here are a few steps that they need to follow to draw a diagram:
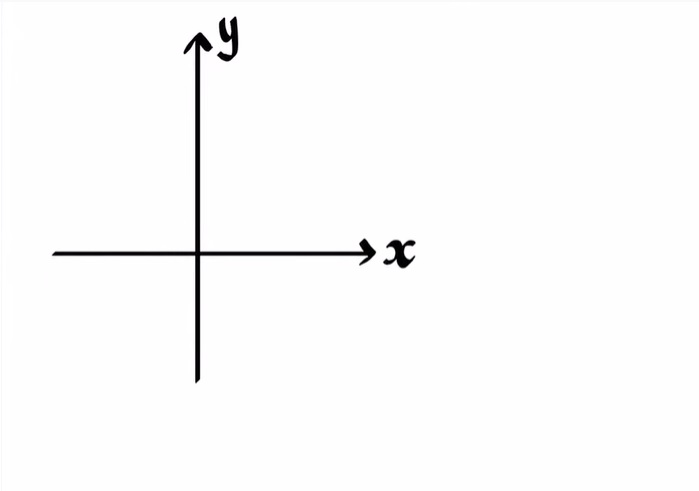
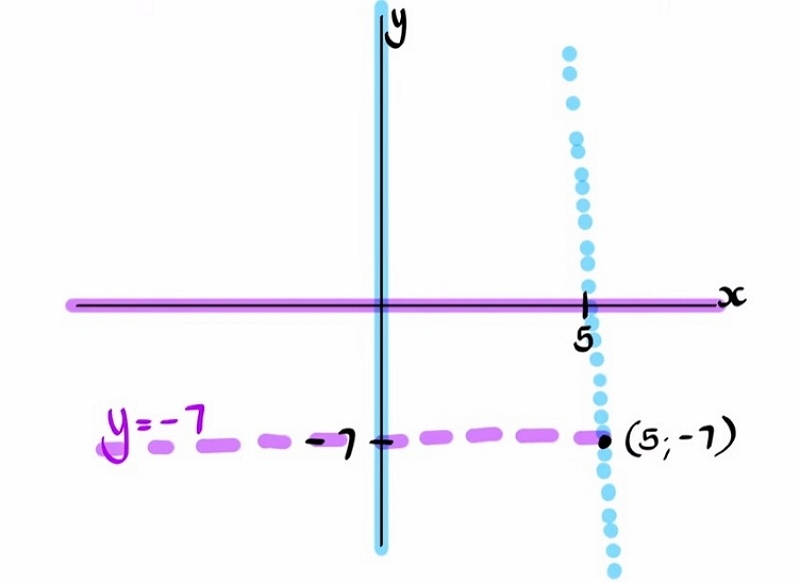
Step 1: To start with the diagram. The students need to draw one vertical and a horizontal line intersecting each other. The vertical line is marked as YY’, while the horizontal line is named as XX’. The point of intersection of these two lines has the coordinate (0, 0).
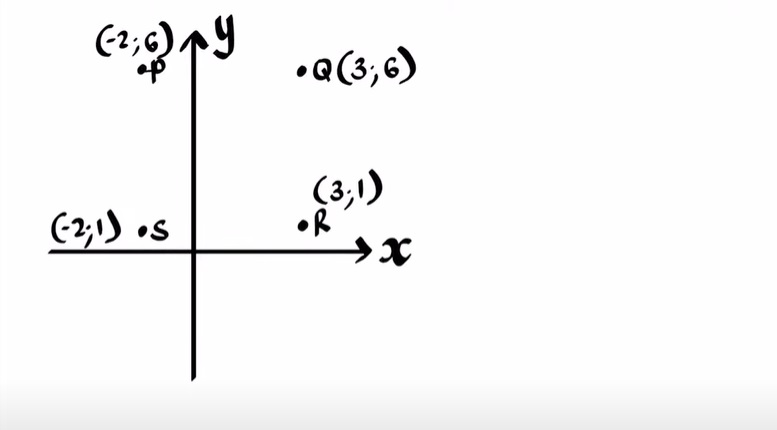
Step 2: To plot the point (x, y), the students need to check the coordinates first. They need to move on x places on the X quadrant from the center and then move y place on the Y-axis.
Step 3: To find the distance between the two lines, the students need to plot the two points. After that, they can use the formula to find out the same. They can also calculate it by simply measuring it with a ruler.
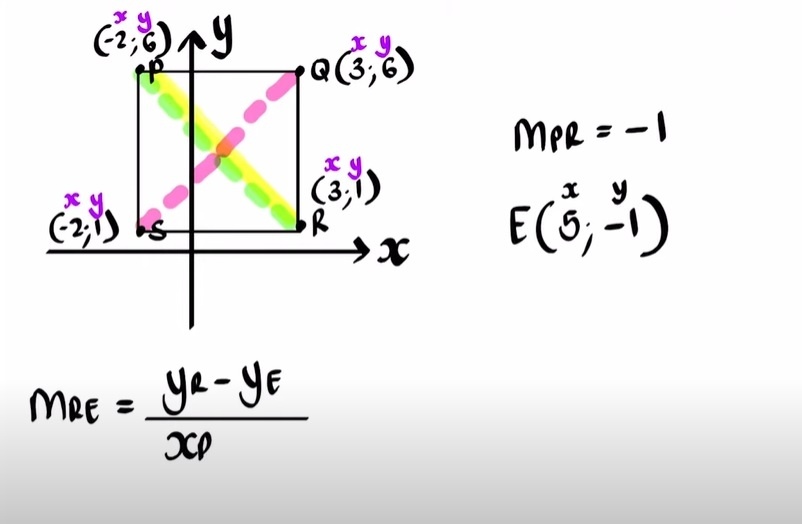
Step 4: While drawing the midpoint of a line present on the Cartesian plane, students can use the formula. But they can also find it out with the help of the diagram. They can join the points and form the lines and then identify the midpoint.
Step 5: They can also determine the gradient, equation of the straight line, angle of inclination, equation of the parallel line with the help of the diagram.
2.2 How to Create Analytic Geometry Online
However, it can be difficult for the students to create a perfect analytic geometry diagram, and they may end up with mistakes because of its complicated nature. To avoid the hassle, the students must use EdrawMax Online tool. The tool is user-friendly. Hence, the user needs no prior experience to handle it. Its easy-to-use interface and top-quality templates are the reason behind its massive user base of 25 million. Here are few simple steps which the students can follow to create their analytic geometry diagram
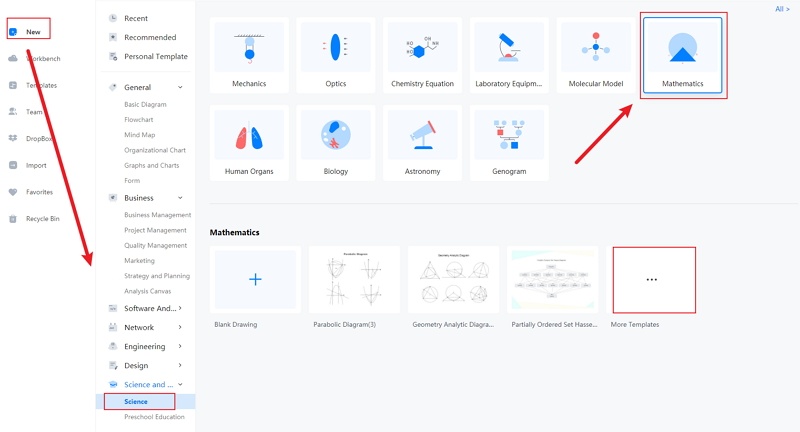
Step 1:The students can work on this tool by simply opening it on their devices. After that, they should open New. Students can use the tool for creating more than 260 different types of diagrams. To draw the analytic geometry diagram, the students need to go to the Science and Education tab. The students can find multiple images and diagrams in this tab, which they can use for their lessons.

Step 2: The students can look for the Mathematics option, which has multiple mathematical diagrams. The high-quality templates are easy to modify, and the students can get the perfect analytic geometry diagram for their projects, studies, and dissertation papers. From the Mathematics option, the students can choose the Analytic geometry diagram.
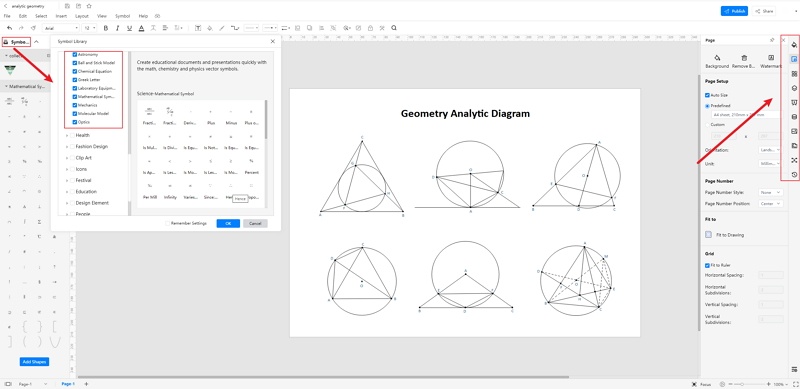
Step 3: When the student has chosen the analytic geometry diagram they require, they need to edit the same. It is essential to modify them on EdrawMax online tool. The students can work on it without any difficulty and produce a high-quality analytic geometry diagram.
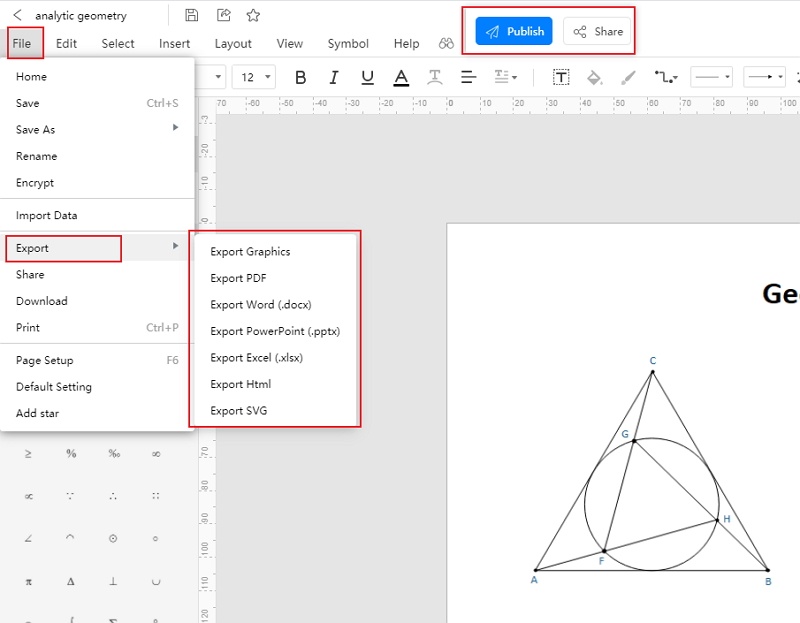
Step 4: Once the students complete their diagram, they can save the images in multiple file formats and also export them for future use. They can access the diagram from several devices. Hence, they can work on the go.
3. Analytic Geometry Examples
Analytic geometry allows scientists to determine the nature and position of the points located in a 2D or 3D plane. Hence analytic geometry is used in architecture, physics, mathematics, and more. Here are a few examples of analytic geometry:
- Find the midpoint of the line segment having endpoints A (4, 6) and B (-2, 8). The midpoint of the line segment: Let the coordinates of the midpoint P be (x, y)
- The centroid of the triangle with vertices (0, 4), (4, 2), (-3-2).
- The slope of a line passing through point А (5, -3). It meets the y-axis at 7. Slope = y2-y1/ x2-x1 = 7-(-3) / 0-5 = 10/(-5) = -2
x= 4-2/2 = 1
y = 6+8/2 = 7
Hence, the midpoint of the line segment AB is (1, 7).
To find the centroid, the students first have to find out the midpoint of each straight line. The midpoint of the line with endpoints at (0, 4) and (-3-2) are (-3/2, 1).
Whereas the midpoint of the line with endpoints (0, 4) and (4, 2) is (2, 3). Hence the centroid of the triangle can be calculated further from this information mentioned above. The centroid is (⅓, 4/3).
4. Conclusion
The students can use an analytic geometry diagram to understand the position, gradient, slope, and equation of a point in the Cartesian plane. They can create one by hand, but the process is complicated. They may fail to get a good result.
To avoid such issues, the students must use the EdrawMax Online tool. The tool will help them to get a perfect diagram for their lessons.
In conclusion, EdrawMax Online is a quick-start diagramming tool, which is easier to make artery and vein diagram and any 280 types of diagrams. Also, it contains substantial built-in templates that you can use for free, or share your science diagrams with others in our template community.


