How to Make a Comparison Chart in Excel
Comparison Charts are made to compare different sets of data visually. It is also called a comparison diagram or a comparative diagram. They are used with both numerical and textual content to show the information and make it easier to understand. You can create comparison charts for different software. Excel is the most commonly used desktop software to make comparison charts and tables. Create a comparison chart in excel by following our guide on how to make a comparison chart in Excel.
How to Create a Comparison Chart in Excel
Step 1 – Launch Excel
To create a comparison chart in Excel, launch the MS Excel desktop app, and select a blank workbook.
Step 2 – Enter Data
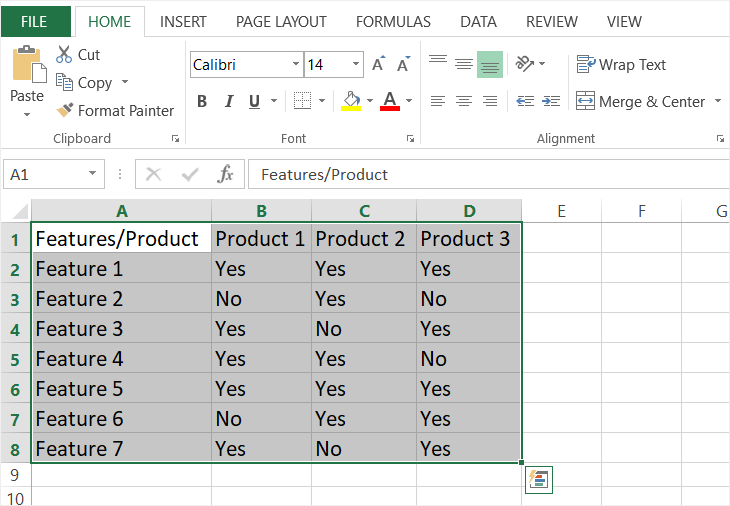
Now enter your data in the workbook. There are many ways of doing that: either copy & paste from another file or you can manually type everything. For this how-to tutorial, we will insert sample data manually. Once you have entered the data, select it.
Step 3 – Inset Comparison Chart
Excel does not have a built-in comparison chart or any comparison chart template Excel. So to create a comparison chart in Excel, we will click on the Border icon in Home Tab. Click on the drop-down arrow and select All Borders. Once you click on All Borders, borders will highlight each cell. Another way of doing this is by clicking on Table in the Insert Tab.
Step 4 – Customize
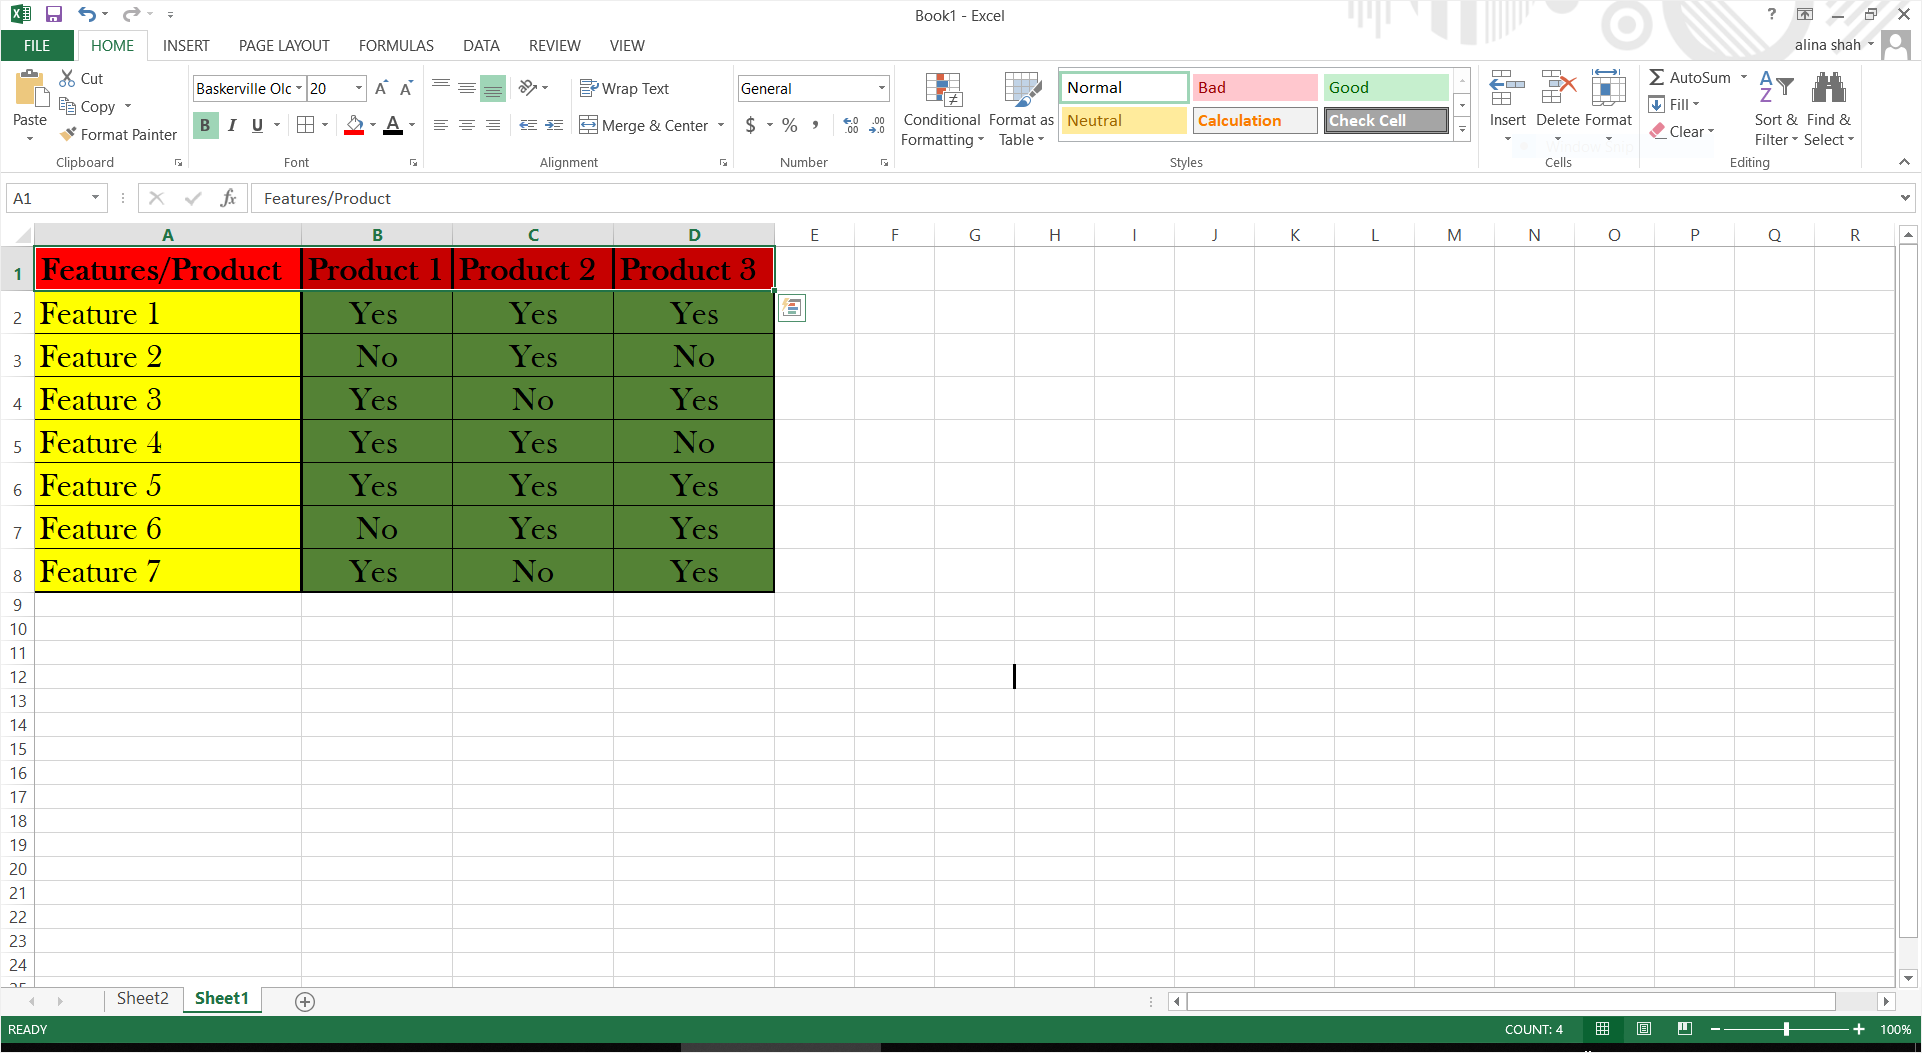
Now a basic comparison chart in Excel is ready. You can edit and customize it to your liking. Excel has many formatting tools to use. You can change the font, add images, add watermark, change colors, and a lot more. Use the Insert Tab and Home Tab to explore all the different options. To add more detail and definition to your comparison chart, edit the border by clicking on More Borders under Borders in the Home Tab.
Step 5 – Save
When your comparison chart in Excel is complete, you can save your final document. Go to File and click on Save. A popup window will appear on your screen. Name your file, browse file location, and click on Save to save your file.
How to Create A Comparison Chart in EdrawMax
Being a multi-purpose graphics tool for visual content, EdrawMax has a wide range of templates for you. As stated earlier, there is no comparison chart template in Excel, but EdrawMax can be used to create more than 20 types of diagrammatic content. To create a comparison chart in Edraw, follow our tutorial on how to create a comparison chart using Edraw.
Step 1 – Go to EdrawMax
Open EdrawMax. Log in with social media credentials.
Step 2 – Search Templates
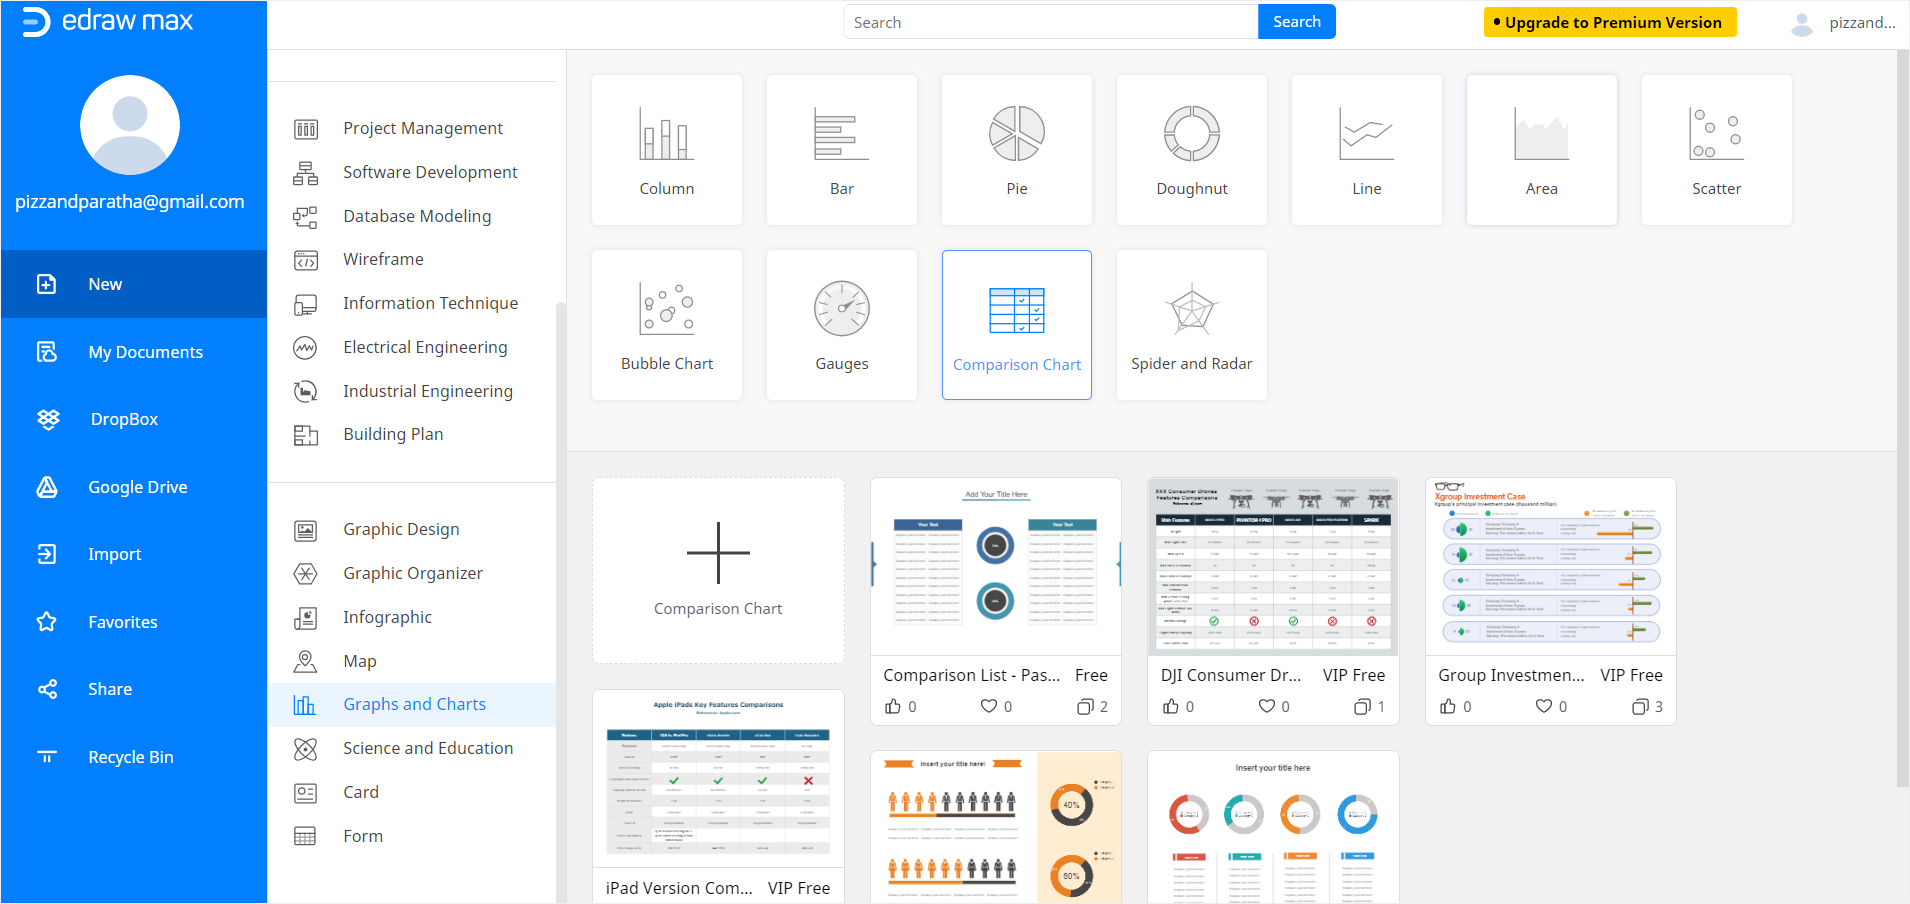
Now scroll down to Graphs and Charts in the navigation pane given on the left side of the screen. Once you click on Graphs and Charts, different types of charts option will be given along with various templates. Now select Comparison Chart and search through the templates. You can use a free Edraw Comparison Chart template or create a blank page to make one from scratch. We will use a free template for this tutorial. Once you click on a template, a new Edraw Tab will open.

Step 3 – Add Data and Customize
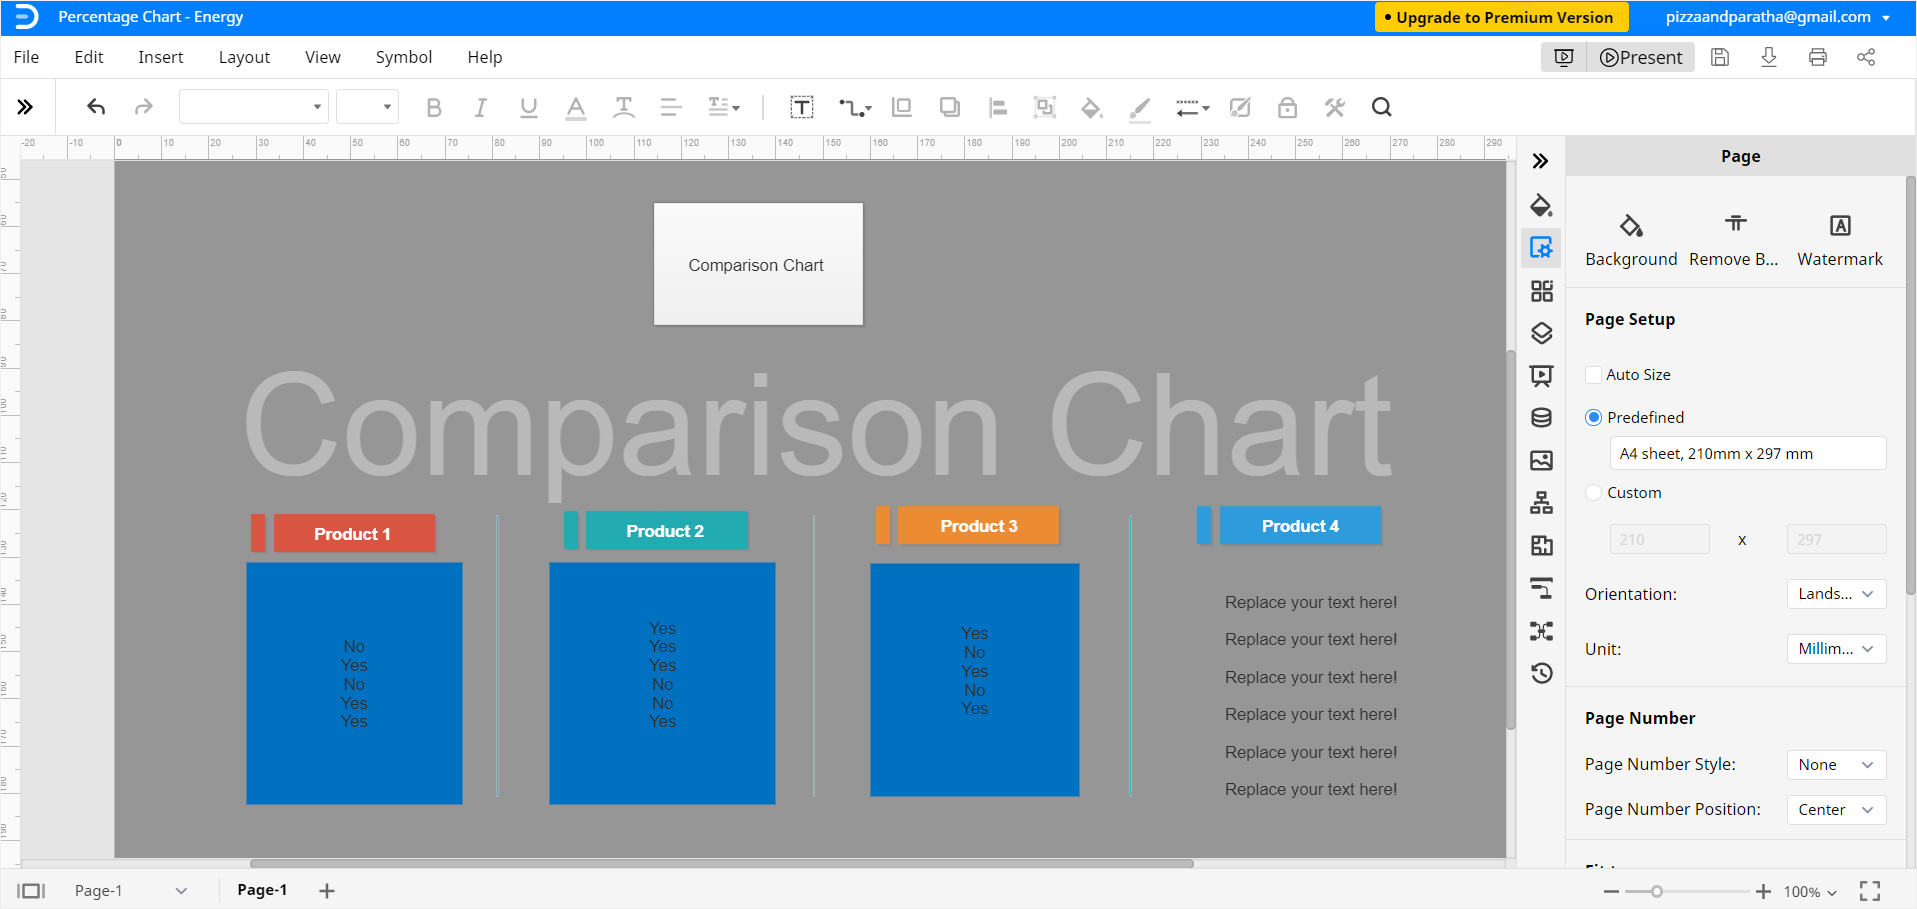
Now you can edit and customize your comparison chart using different formatting tools on the right side of the screen. Adjust the size, shape, color, alignment, and other details according to your liking. You can enter all the relevant data in your comparison chart by simply typing it.
Step 4 – Save
Once you have completed the comparison, you can save the file for later use or edits.
How to Save an Edraw Chart as an Excel File
EdrawMax Online enables you to export and share Edraw documents in the file format of MS Excel and other software. To save an Edraw file as MS Excel document, click on File > Export and click on Export to Excel (.xlsx). In this way, you can view and edit your Comparison Chart in Excel and share it with those who use the corresponding software.
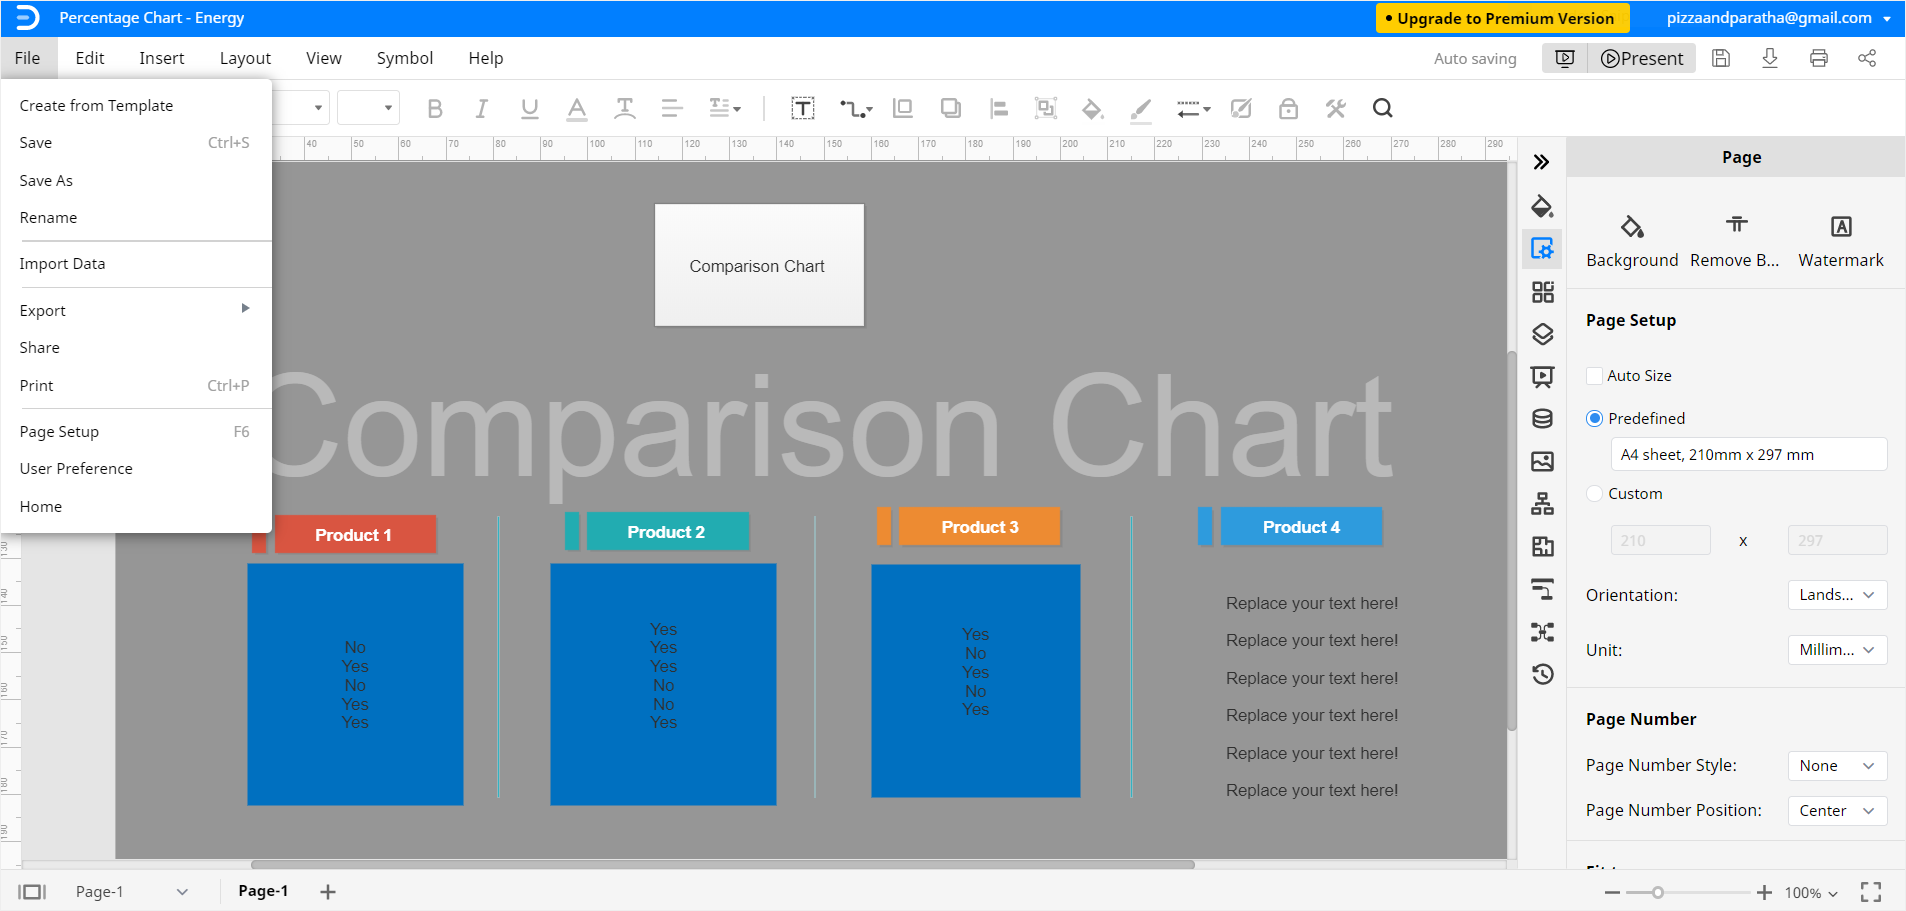
You can also save Edraw documents in Google Drive and Dropbox for online sharing and cloud protection. Click on File, and then Save as. Select the desired cloud location and click on OK.
Our essential tutorial on how to make a comparison chart in Excel and EdrawMax Online ends here.


