How to Create a Flowchart in Excel
If you are new at making flowcharts and don’t know any professional flowchart maker, you may prefer to learn and use a common tool like Microsoft Excel to create a flowchart.
In this article, we will go over how to create a basic flowchart in Excel and then share a more efficient diagramming tool -- EdrawMax -- which is easier, faster and more productive than Excel in creating flowcharts.
How to Create a Flowchart in Excel
Before Creating a Flowchart in Excel
Before you start to draw a flowchart in Excel, you need to do some preparation to get Excel ready for creating diagrams.
a. Create a Grid
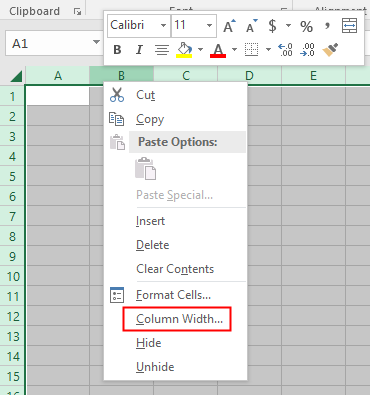
Click any cell in the worksheet and press Ctrl + A or click the triangle icon in the upper left corner of the worksheet to select all cells. Right-click on the column heading (A, B, or C...) and choose Column Width.
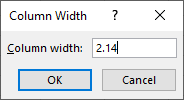
Input 2.14 in the box of Column Width and click OK. By doing that, the column width of the cell will be equal to its row height (15 points) when the default font of the worksheet is Calibri and the font size is 11.
b. Enable Snap to Grid
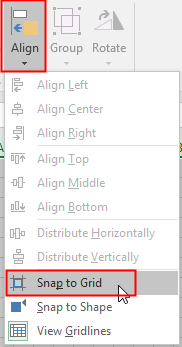
Go to Page Layout tab, click Align and select Snap to Grid.
The Snap to Grid feature is used for snapping shapes to the nearest intersection of the grid so that it will be easy to move or resize shapes on the grid.
c. Set Page Layout (Optional)
Go to Page Layout tab, choose Margins, Orientation, Size or Background to make corresponding modification to the page layout.
If you want to fit your flowcharts into a Word document or the direction of the flowchart will be from left to right, you need to change the page layout to meet your requirements.
5 Steps of Creating a Flowchart in Excel
a. Add Shapes
After creating the grid and enabling Snap to Grid, you can add flowchart shapes in Excel via 2 ways.
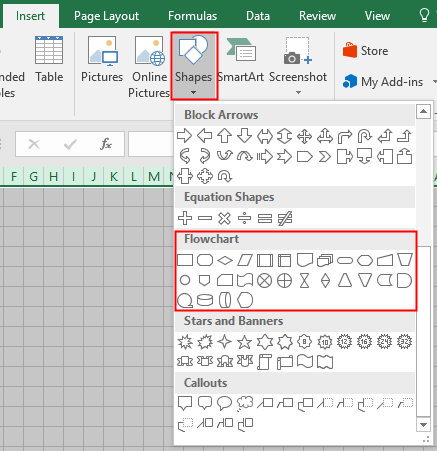
Firstly, go to Insert tab, click Shapes and choose flowchart shapes in the drop-down list. Each flowchart shape has its own meaning and it’s a common way to add flowchart shapes in Excel.
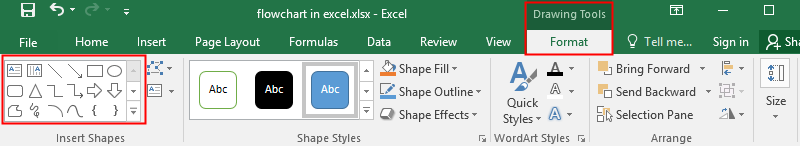
When you add a shape on the grid, Format tab will pop up on the ribbon, so you can add shapes from the shape gallery in Format tab by clicking the shape and drawing the shape on the gird.
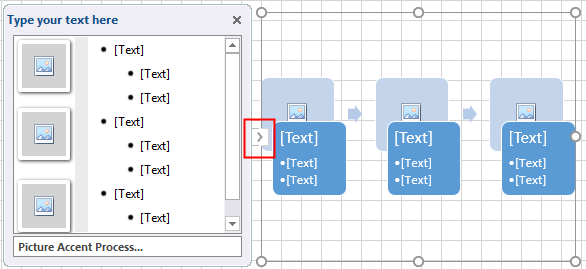
Secondly, click SmartArt on Insert tab, Choose a SmartArt Graphic dialogue box pops up and select Process category in the left pane.
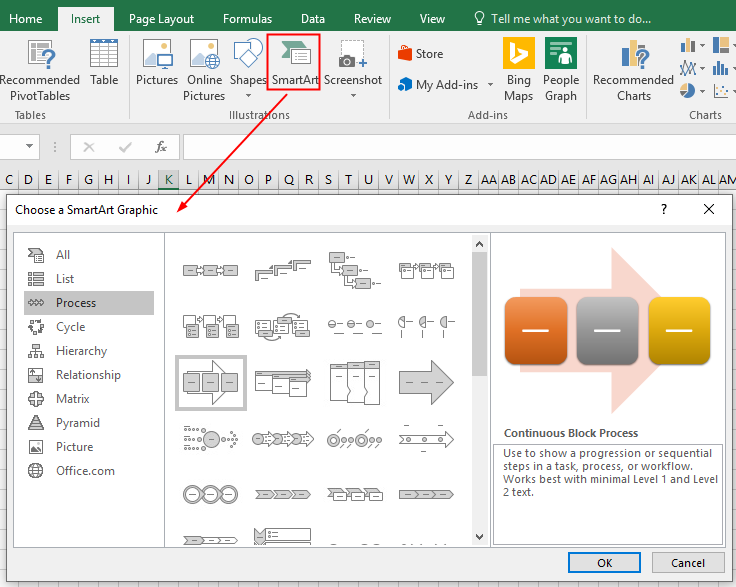
In fact, the SmartArt graphic gallery doesn’t provide standard flowchart shapes or symbols. However, since flowcharts are usually used to show steps of tasks, processes and workflows, so the graphics from the “Process” category is recommendable and applicable to visualize your flowcharts.
b. Add Connector lines
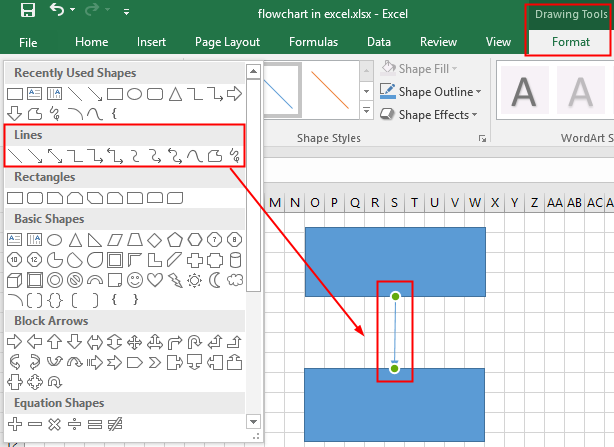
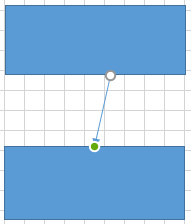
Go to Insert or Format tab, choose Line symbols in the shape gallery, then the cursor turns into a plus icon. Put the cursor on one of the shapes you want to connect, and you’ll see the gray connection points on the shape.
Click on the connection point where you want to start the line, then drag the cursor to the other connection point on another shape and release the mouse.
When you successfully connect two shapes, the connection points will become green.
However, if the connection failed, the connection point will become white and you need to adjust the line to the right place.
c. Add Text
To add text on shapes, just click the shape and you can edit text on the shape directly or you can right-click on the shape and choose Edit Text in the menu.
To add text on SmartArt graphics, click the arrow icon on the graphic and type the text on the dialog box.
To add text on connector lines, it’s not as easy as adding text on shapes. You need to add text boxes at first. Go to Insert or Format tab, click Text Box, the cursor becomes a long plus icon, and you can draw and add a text box beside the line.
d. Add Callout (Optional)
Select callout shapes on the shape gallery of Insert or Format tab.
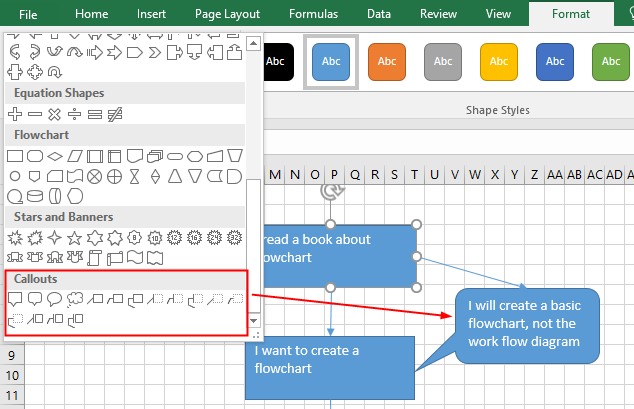
Choose a callout shape and add it on the grid. Drag the callout shape to connect it with the desired flowchart shape.
If you want change the position of the connection point without altering the position of the flowchart shape or callout, you can just drag the yellow connection point to move the connection part.
e. Customize a Flowchart
Once you make a basic flowchart, you can format the shapes, text and connector lines with the format options in Excel.
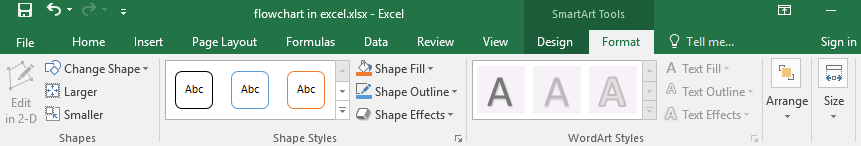
If you select a shape:
The format options mostly lie on Format tab. The Shape Styles option is for changing the shape styles, like shape fill, shape outline colors and shape effects. The WordArt Styles option is for changing text styles, including text fill, text outline colors and text effects.
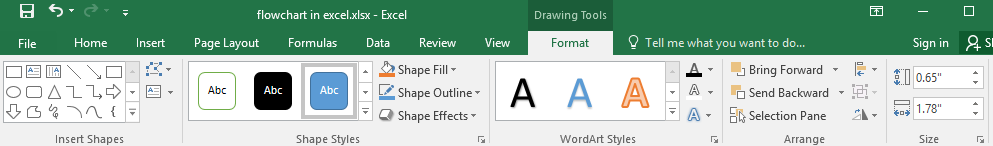
The Font and Alignment options in Home tab are used for changing the font and alignment style of the text.
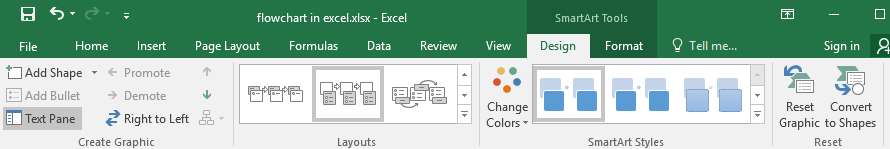
If you select a SmartArt graphic:
SmartArt tools will show on the ribbon, including Design and Format tab. You can change the design and format of the selected graphic by choosing the corresponding options in these new tabs.
How to Create a Flowchart in EdrawMax
Making a flowchart in Excel is not quite easy and needs users to make lots of page layout changes before inserting shapes and connector lines. Besides, it also requires a lot of additional steps to build a complete and complicated flowchart.
Compared with using Excel, creating a flowchart with EdrawMax could be a piece of cake! You don’ t need to spend much extra time in making preparations. With pre-designed flowchart templates and various flowchart symbols, EdrawMax can save both your time and energy to create high-quality flowcharts.
The steps of creating a flowchart in EdrawMax:
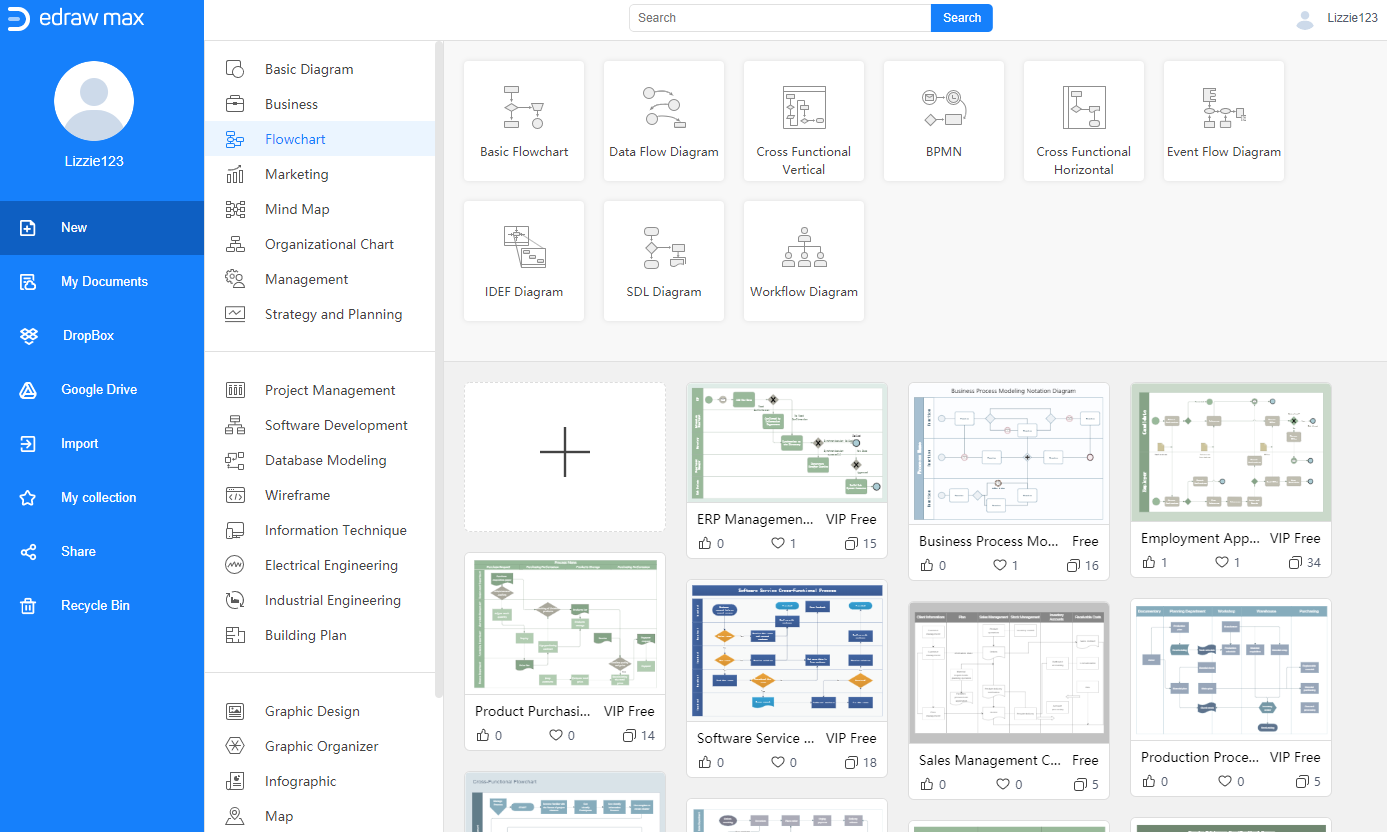
- Enable EdrawMax and select a desired kind of flowchart template in the gallery.
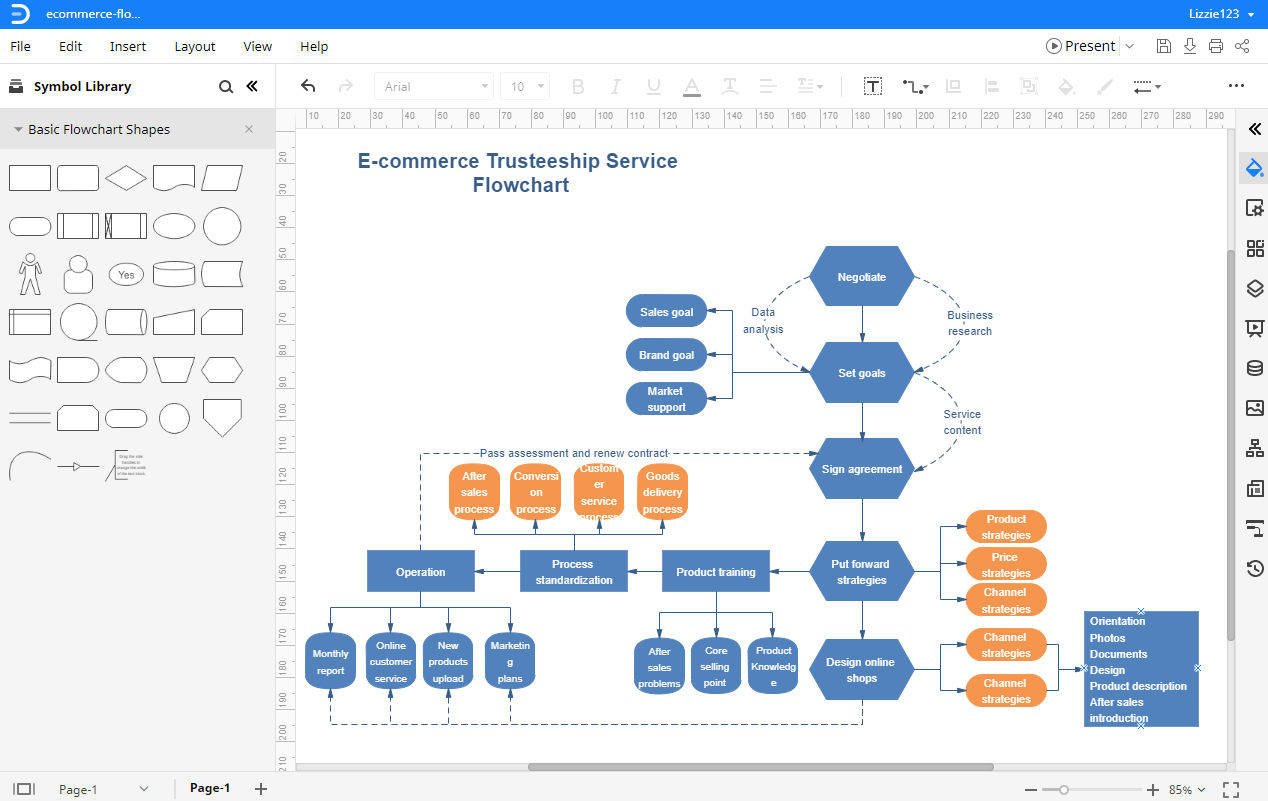
- Double-click on the template icon to enter into the drawing interface and the flowchart symbol library will show on the left side of the canvas.
- Modify and customize the structure and format of the selected flowchart template to create your own flowchart with various drawing tools on the right panels.
- Save and export the flowchart to common file formats such as Office, PDF, HTML and graphics.
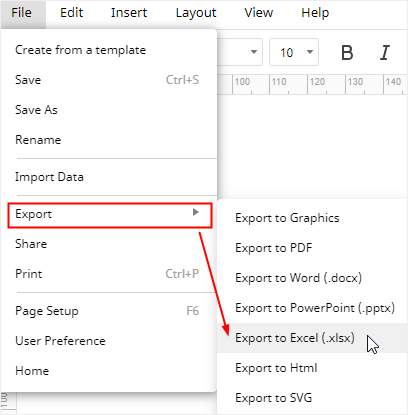
How to Export an EdrawMax diagram to Excel
You can build creative and complicated diagrams in EdrawMax and export them into editable Excel files. Go to File tab, click Export > Export to Excel, and the system will automatically save and download the created flowchart as an Excel file. So you can get a flowchart in Excel format. All the Microsoft Office files exported from EdrawMax are editable.
Thus, there will be less trouble or difficulty in creating a flowchart in Excel with the help of EdrawMax and you can freely share your diagrams made by EdrawMax with your colleagues or friends who don’t use EdrawMax.
In addition, you and your friends are able to edit and modify the exported flowchart in Microsoft Excel (only for 2013 or above version) directly.