How to Make a Gantt Chart Quickly and Easily
Create a Gantt Chart Online Free Free Download Free Download Free Download Free DownloadWhen to Use a Gantt Chart
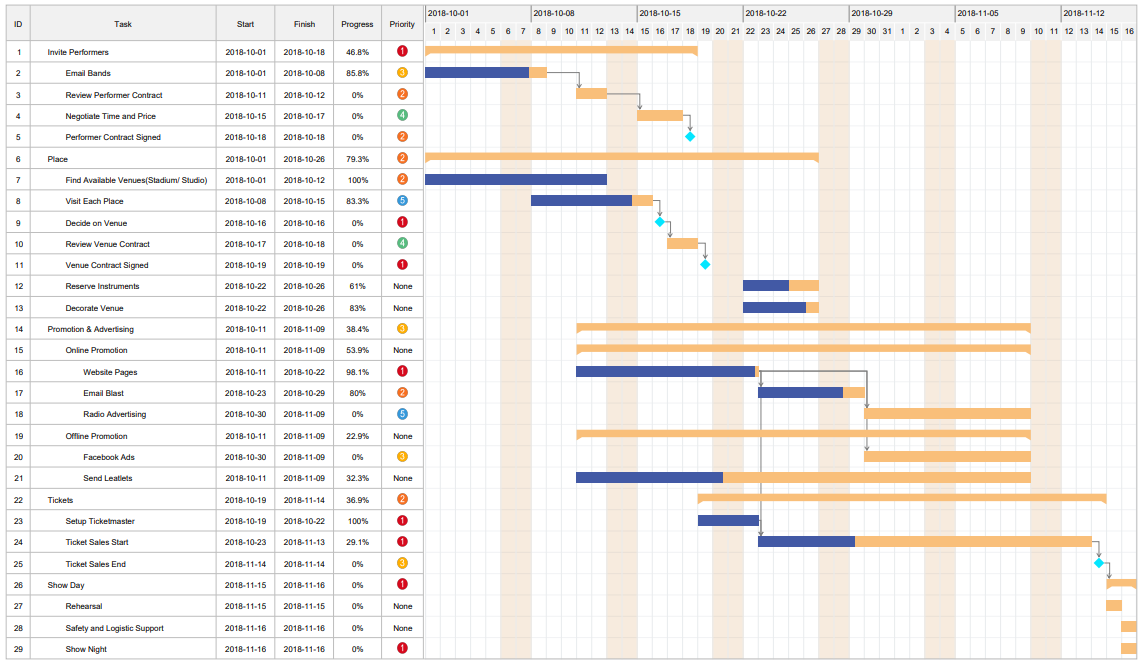
You may have heard of Gantt charts if you are working as a project manager or in a position that involves scheduling tasks, resources or estimating costs. As you can see in the below picture, a basic Gantt chart consists of 2 parts – a task table and a timeline view pane.
With a Gantt chart, you can track the project process, identify necessary tasks, mark task priority, etc. When you are using a Gantt chart, you must have a plan for things you are going to do, no matter whether you do that for a working project or a period of your life. You can even use a Gantt chart for planning and making a great show.
Prepare For Making a Gantt Chart
Before you display these necessary tasks into a Gantt chart, you need to prepare some related data for completing the chart.
- Task names and ID: They should be listed in proper order. (Necessary)
- Start date and Finish date for each task: For those unfinished tasks, you can preset the finish dates. (Necessary)
- Duration Days: Need to count how many days are taken on completing the task.
- Task Completion: Mark with a percentage.
- Task Dependencies: Show a dependent relationship between task, for example, task 1 must be finished before task 2 gets started, and they share the same resources. (Necessary)
How to Make a Gantt Chart
Without professional Gantt chart makers, it will be difficult and inflexible for you to draw a Gantt chart. Since Gantt charts become the go-to method for visualizing a project, the next big question should be: “How do you make a Gantt chart quickly and easily?”
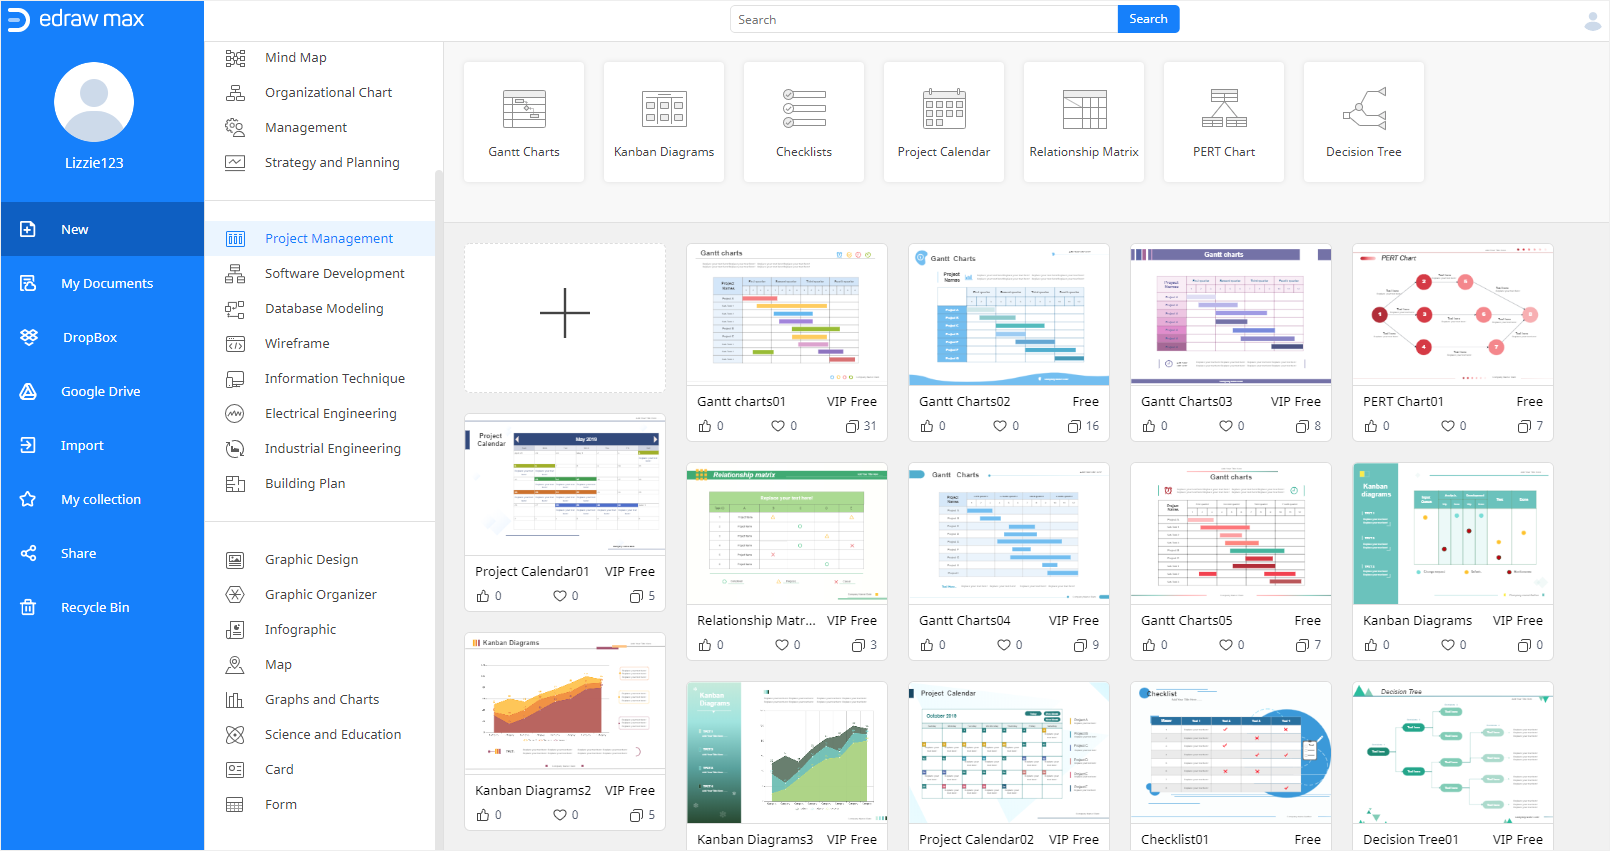
In this section, we will show you how to make a Gantt chart online using EdrawMax, which is an easy-to-use and effective Gantt chart maker for beginners. Here’s how to do this.
Step 1 Start with a Blank Template
Log in (EdrawMax Online) with your Edraw account. Find Project Management on the left diagram type menu and click the plus icon on the template gallery.
Now a blank template is open on a new webpage and the next step is to import the data that you prepare for making the Gantt chart.
Step 2 Import Project Data
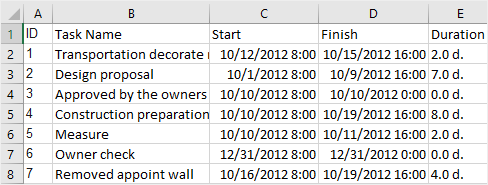
Use the project data which should be saved as an XLSX or CSV file, and click the Import button on the Gantt Chart pane.
Find the data file in your computer and click OK, then you will see that EdrawMax Online auto-creates a Gantt chart based on your data like the example Gantt chart below.
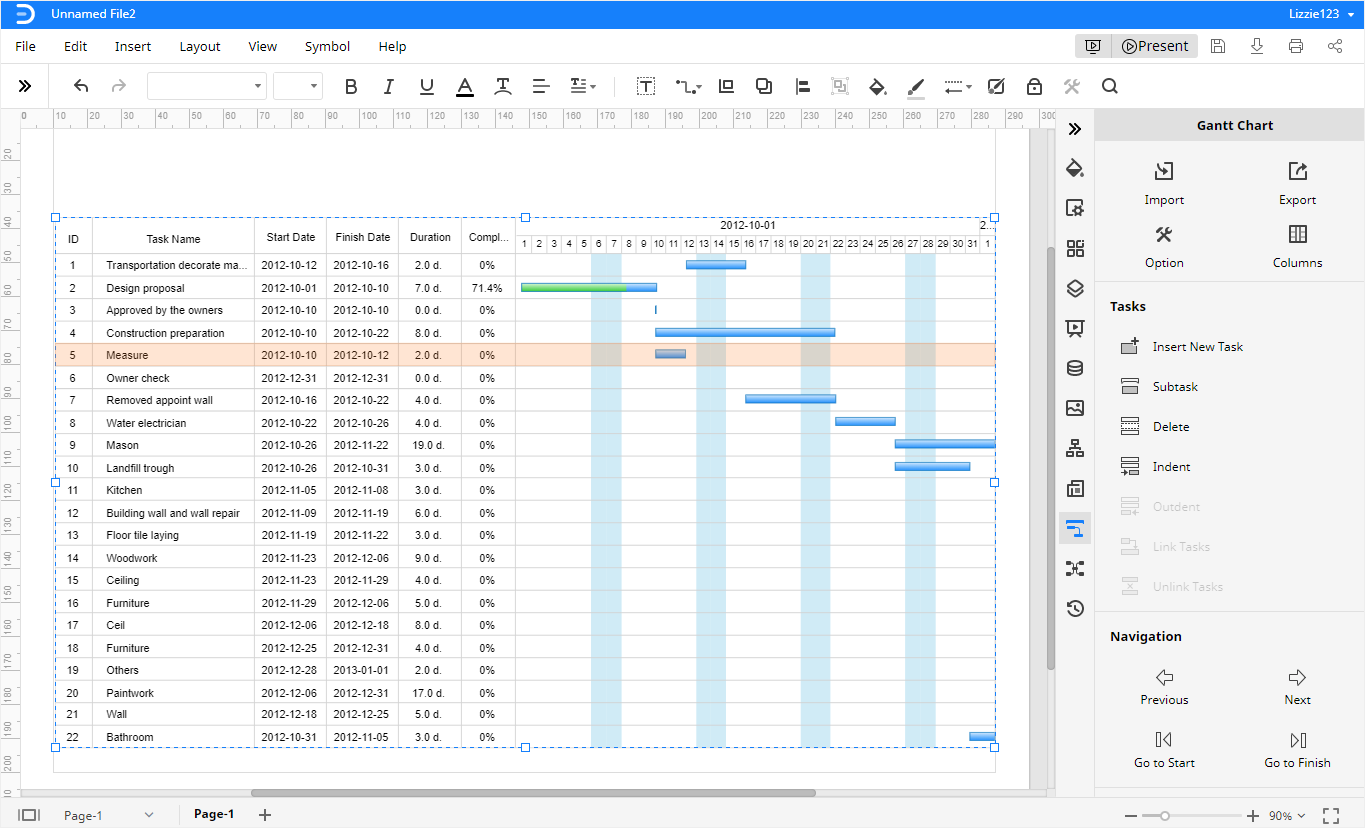
Note that the project data should be listed in proper order and not miss the necessary information like task name, start date, and finish date. When you get the data processed, you’d better save it in an Excel file.
Step 3 Add Subtasks
Sometimes, you may want to divide a big task into several small ones so that you can make it more specific and know what you should do in the next period.
Here, in EdrawMax Online, you can use the task editing options to add subtasks for the select big task.
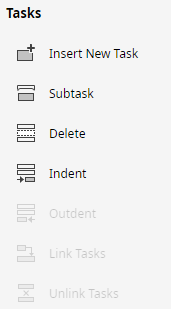
Select the target task, click on Subtask on the Gantt chart pane. Then a new subtask will be added under the selected task. Thus, you should know that now, the completion of the task Remove appoint wall will depend on its subtasks.

Step 4 Link Tasks
If there is a dependent relationship between two tasks, you can call it Task Dependency. You can add links between tasks to represent the relationship.
For these 2 tasks, choose one as the predecessor and the other one is the successor. Click on the blue taskbar of the predecessor, drag the mouse to move to the bar of the successor when the cursor becomes a four-head arrow.

Step 5 Modify Task Information
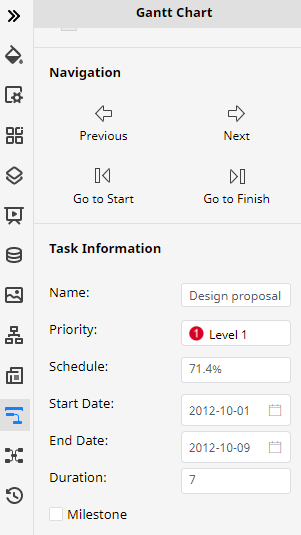
Once you need to modify task information, there is a quick way to make it.
Go to the Gantt Chart pane, scroll down to the bottom and now you can change the basic information of the selected task, including the task name, priority, completion percentage, start date, and finish date. Besides, you can also tick the Milestone to mark the selected task as a milestone.
Free Editable Gantt Chart Examples
Generally, all the Gantt charts look similar to each other, but they also have a difference when you use them for different purposes.
You can go to visit these Gantt chart templates and get ideas on how to build your own Gantt chart.
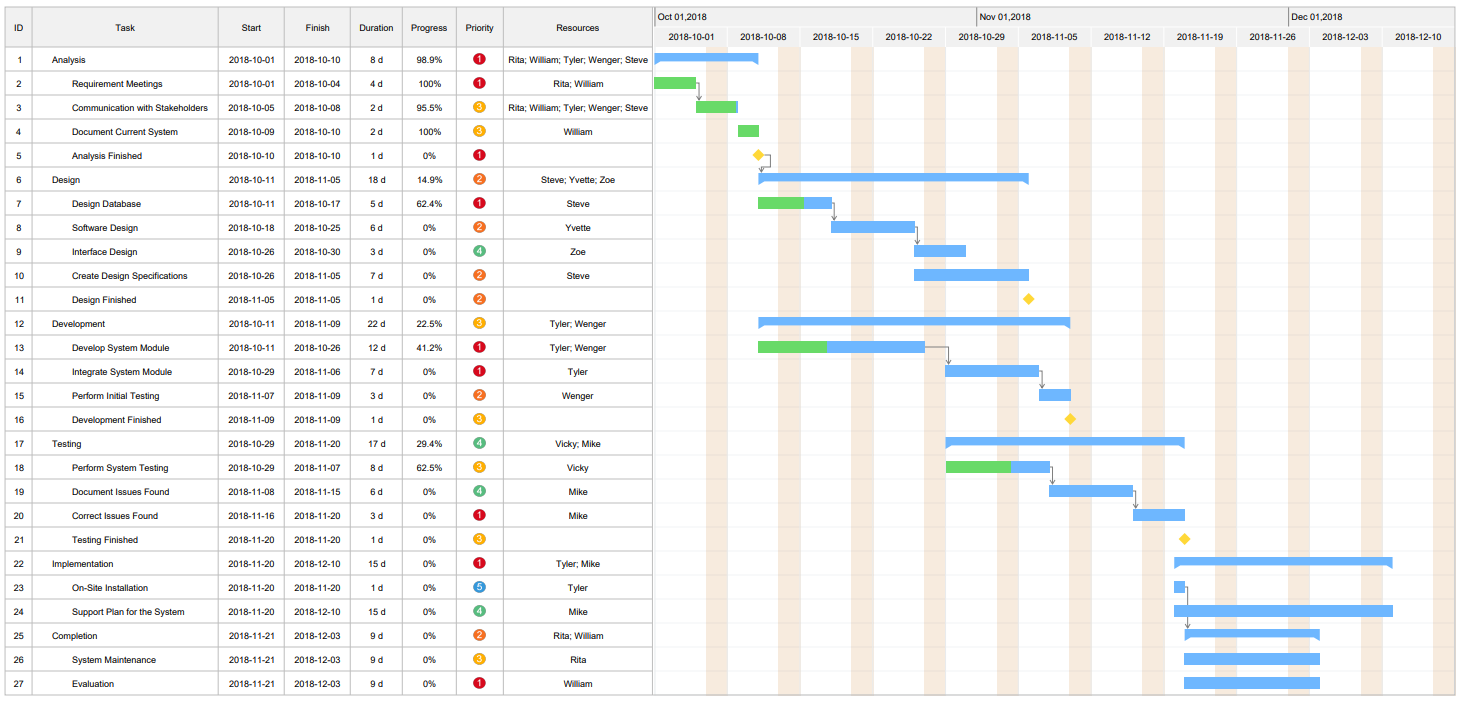
This template shows a project for developing new software.
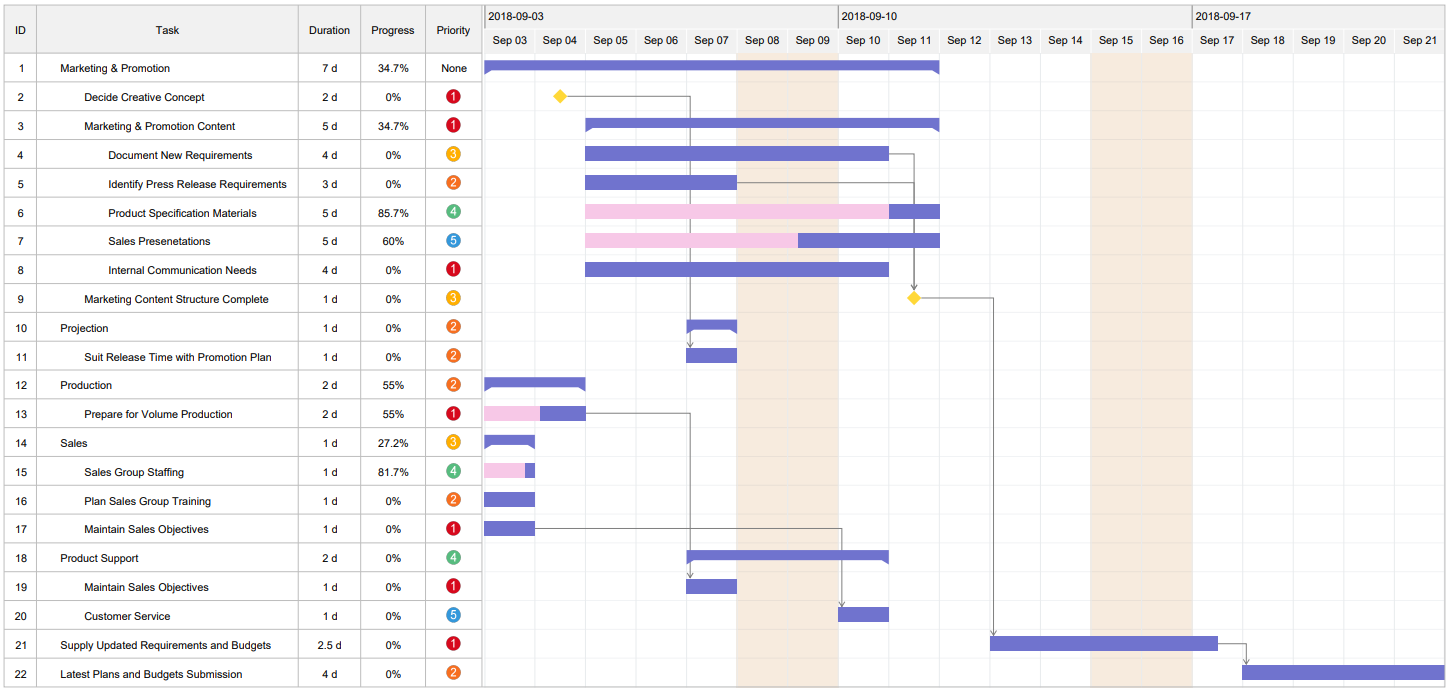
Now you will see a Gantt chart that displays a project for launching a new product in a company.
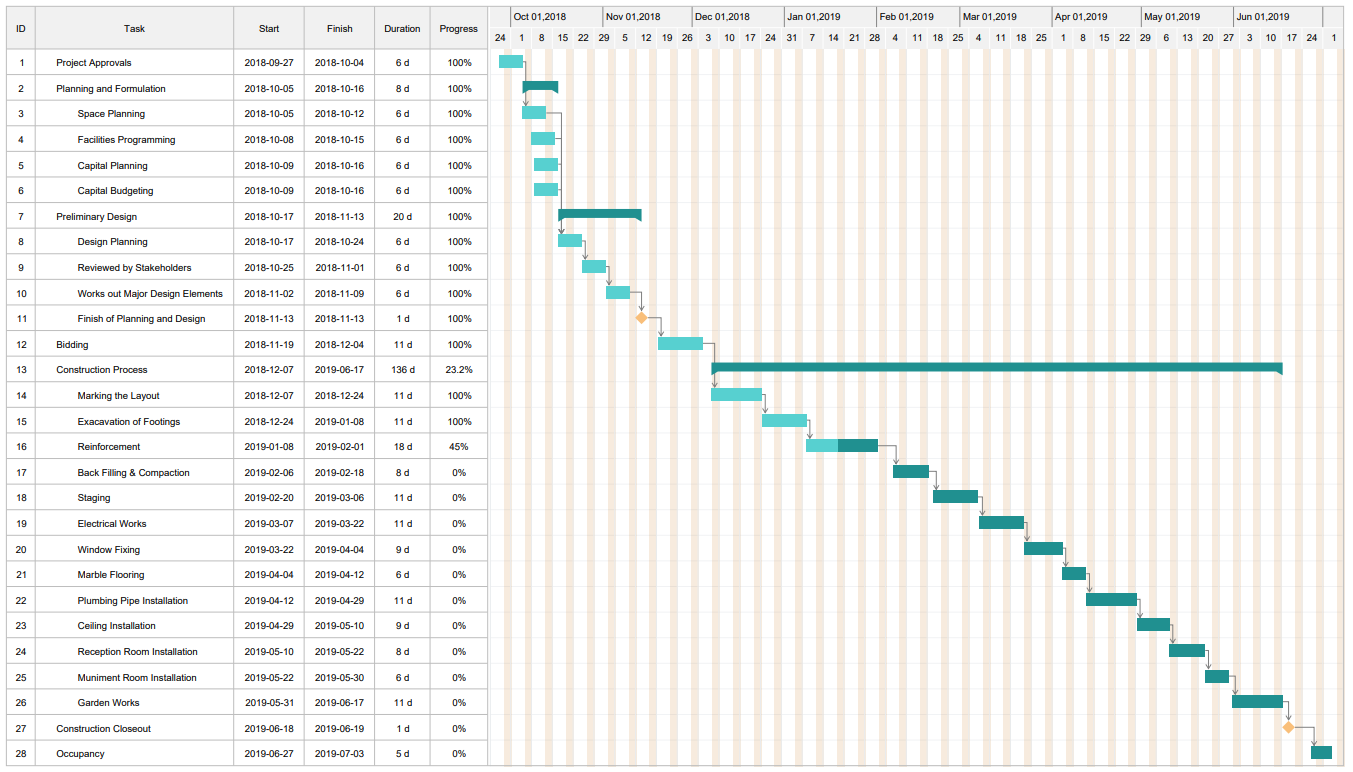
A Gantt chart can also be used in government projects.


