How to Make a Gantt Chart in Google Sheets
Google Sheets is a perfectly suitable application in G suite for creating Gantt charts and make it easy to share project schedules in your project team. However, you’d have to use the time-consuming features to make a Gantt chart, which is less efficient than in professional tools.
How to Make a Gantt Chart in Google Sheets
Step 1: Open a New Spreadsheet
Search Google Sheets on the browser and click to create a new blank spreadsheet.
Step 2: Input the Data of Project
On the new spreadsheet, you at least need to enter or paste the task names, start dates and finish dates for making a Gantt chart. These tasks would be listed in the order of occurrence and the date format should be as follows: Month/Day/Year.
Apart from those, creating a Gantt chart still needs the data of the Duration in Google Sheets, which is the actual amount of the days to complete each task.
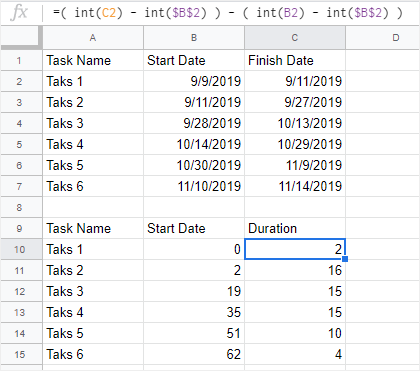
In this example, to calculate the duration days, we use the formula as shown above:
=( int(C2) - int($B$2) ) - ( int(B2) - int($B$2) ). This formula represents “Task Duration = Finish Date – Start Date“.
In the meanwhile, the formula for calculating the column of Start Date (B10 : B15) is that “int(B2) - int($B$2)”. If you don’t figure out this column, it will be hard for you to continue the following steps.
Thus, we get a new table (A9 : C15). This table will be the actual data for creating a Gantt chart in Google Sheets, which is different from creating a Gantt chart in Excel (https://www.edrawmax.com/gantt-chart/how-to-make-a-gantt-chart-in-excel/).
Step 3: Insert a Stacked Bar Graph
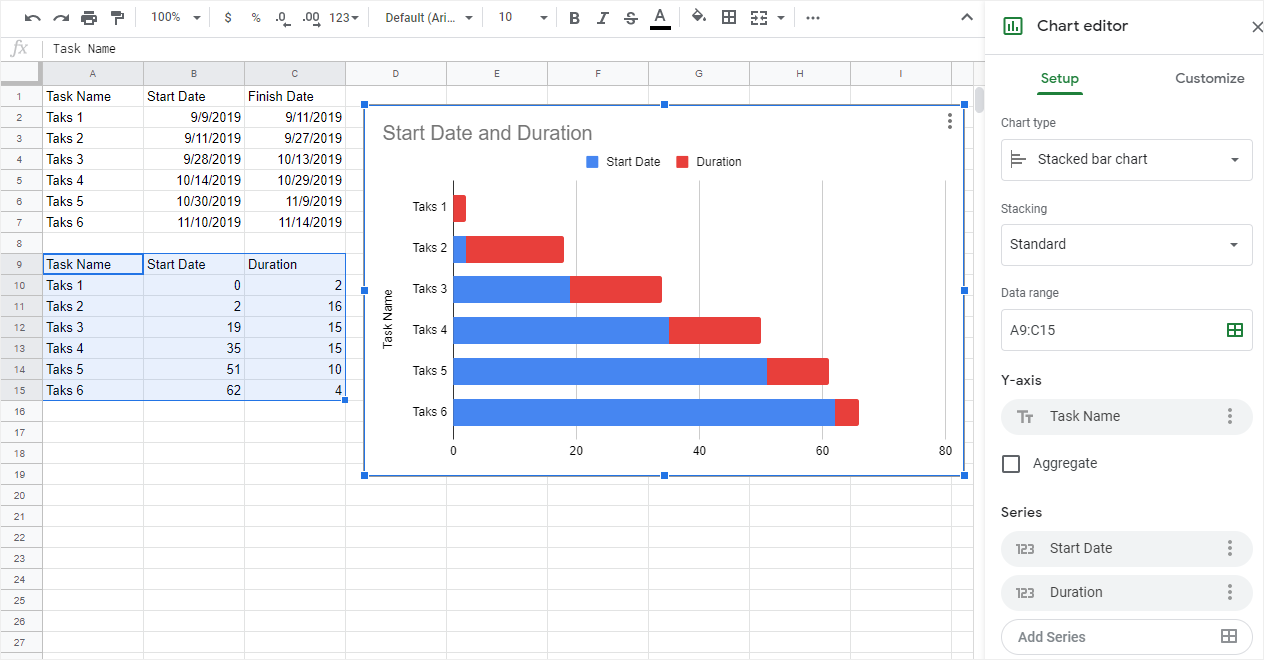
Select the new table (A9 : C15), go to the “Insert” tab, click “Chart” on the drop-down menu, and you will see a stacked bar graph and the Chart editor pane shown on the spreadsheet.
Step 4: Transform the Bar Graph into a Gantt Chart
Click to select all the Start Date bars (the blue bars) on the bar graph, the Chart editor pane will automatically direct into the Customize tab, and you can change the bar color under the Series group.
Click the Color button under the Format option, select None on the color menu.
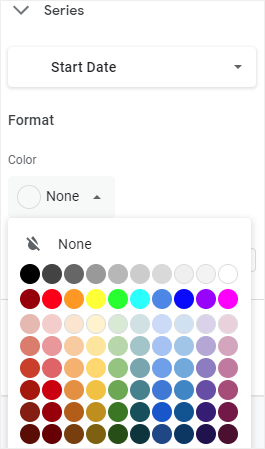
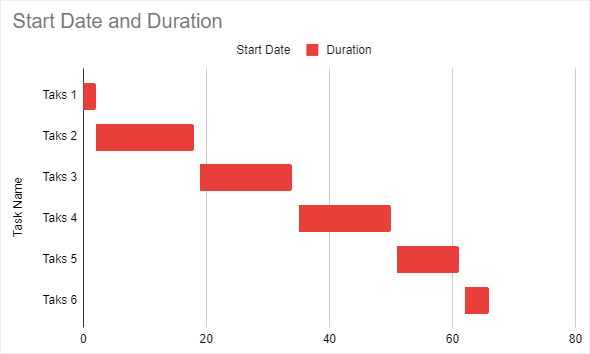
Therefore, the final Gantt chart will be like:
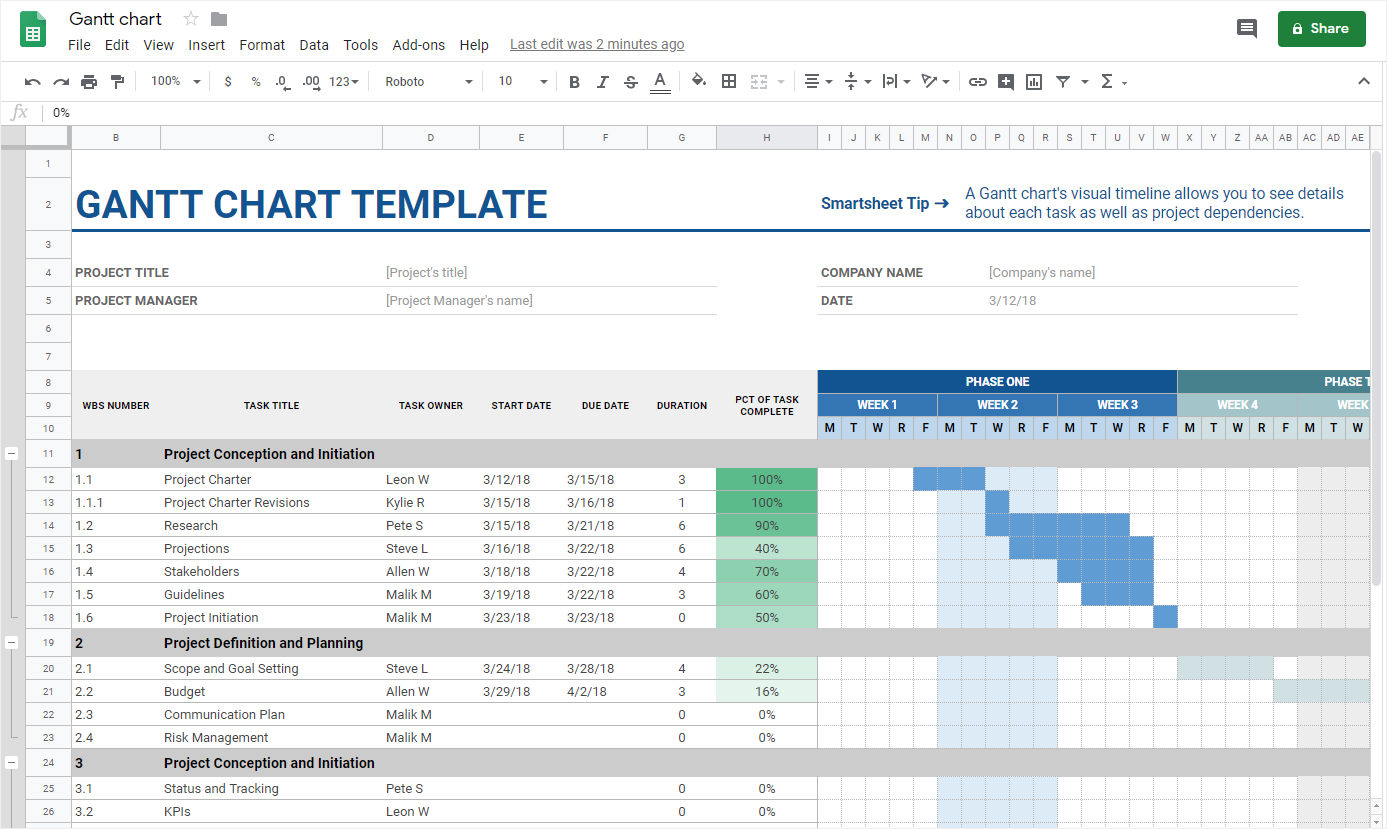
Open the Template gallery in Google Sheets, and you will find a Gantt chart template under the Project management category.
Click on the thumbnail to open the template, then you can enter your project information and project data into this template to make your own Gantt chart.
How to Make a Gantt Chart in EdrawMax
You can make a Gantt chart in Google Sheets manually or with the help of pre-made templates. However, both ways can be tricky and time-consuming. Next, we will introduce you to how to streamline the process using EdrawMax.
Step 1: Pick Your Favorite Gantt Chart template
As you can see, EdrawMax provides abundant inbuilt templates for users. If you don’t find desired templates in the application, you can also search on (Edraw Template ) and download any template on your computer.
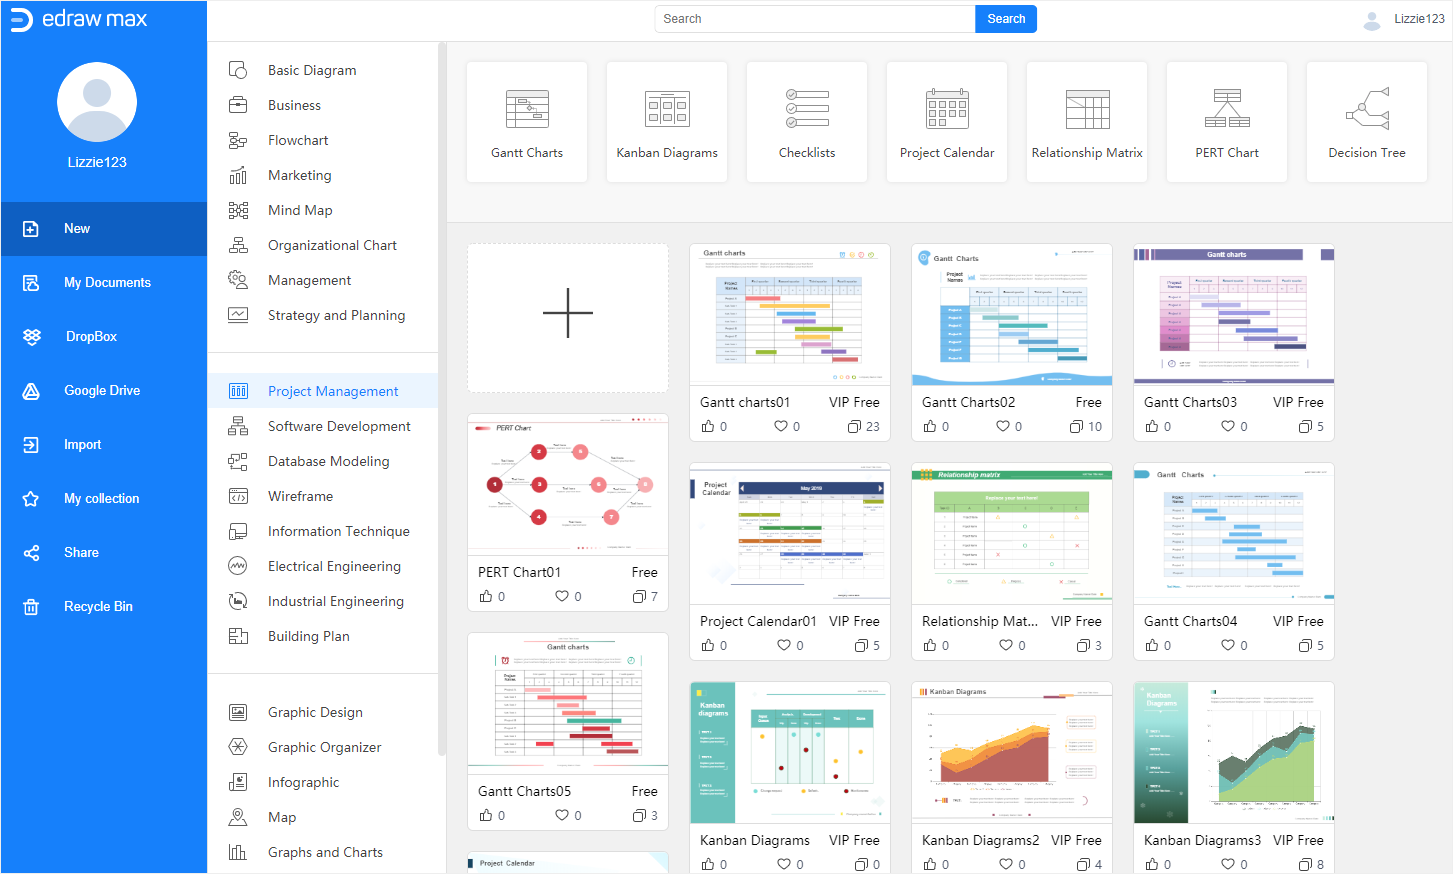
Step 2: Open a Gantt Chart Template
Click on the template thumbnail and EdrawMax will open this template for you automatically.
Or, if you already have downloaded some Gantt chart templates from Edraw Template, you can click the Import button on the Home page, and follow the instructions to open the template in EdrawMax.

Step 3: Import Project Data
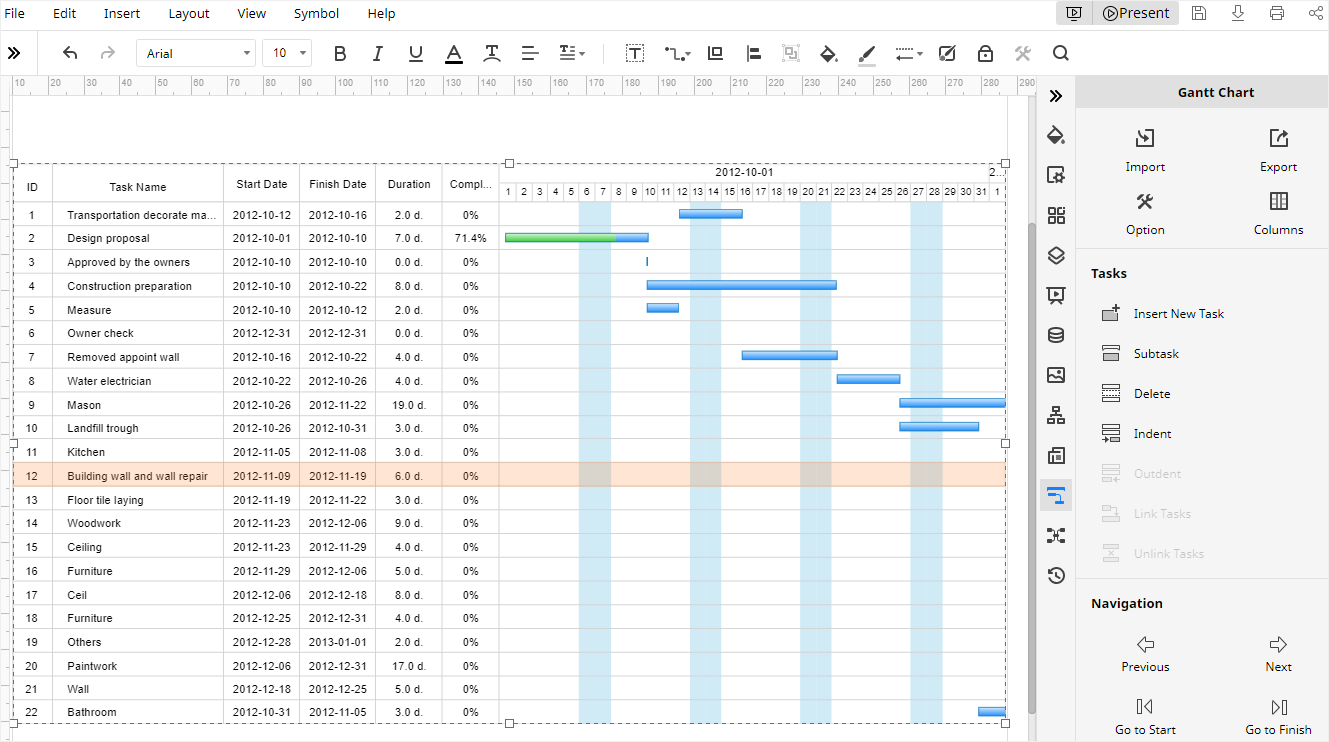
The other way of making a Gantt chart in EdrawMax is to import the project data and EdrawMax will auto-generate a Gantt chart. Before that, you should arrange the project data and the information of task names, start dates, finish dates, duration days, etc. should be included at least.
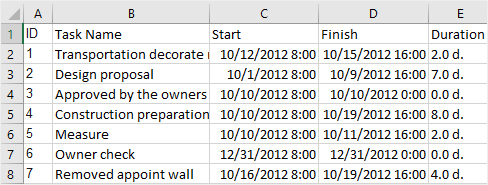
Open a blank template, click on the Gantt Chart icon ![]() on the right sidebar and click the Import button on the Gantt Chart pane. Follow the instructions and the Gantt chart will be like:
on the right sidebar and click the Import button on the Gantt Chart pane. Follow the instructions and the Gantt chart will be like:
Step 4: Customize Your Gantt Chart
For using a template, you can use the formatting tools on the Fill/Line/Shadow pane (![]() ), Page Setup pane (
), Page Setup pane (![]() ) and Theme pane (
) and Theme pane (![]() ) to change colors, backgrounds and themes.
) to change colors, backgrounds and themes.
For importing project data, you can go to the Gantt Chart pane, modify task information, change the columns and data formats shown on the chart.
With these formatting tools, you are able to make any kind of Gantt chart as you like.
Are you a team manager looking for a diagramming tool that can help you with both Gantt chart creation and team management? If so, EdrawMax is the perfect solution for you. EdrawMax is a powerful Gantt chart tool that makes it easy to create accurate and visually appealing charts. It also includes a team management feature that allows you to easily modify team memberships and share diagrams with your team. To learn more, visit EdrawMax Business today.
How to Export a Gantt Chart to Excel
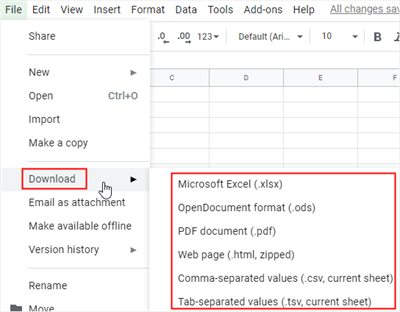
In Google Sheets, you can download the Gantt chart you make in different file formats. Go to the File tab, click Download on the drop-down menu and you can select Microsoft Excel on the menu, thus the Gantt chart will be exported as an Excel file.
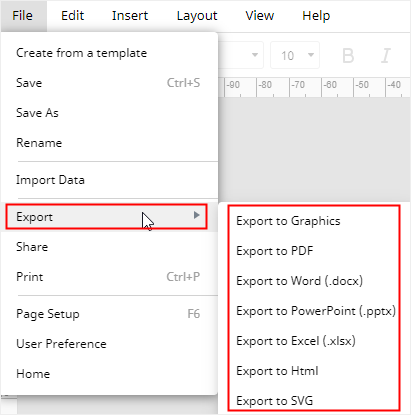
In EdrawMax, go to the File tab, click on Export on the drop-down menu, and you will find that the Gantt chart can be exported and downloaded in many common file types, such as graphics, PDF, Word, Excel, PowerPoint, etc.
Especially, all the MS Office files exported from EdrawMax are editable and printable. It will be more convenient and efficient for you to share your Gantt charts with others.
To share your Gantt charts with others, you can also click on the Share button on the drop-down menu or on the upper right corner of the main interface. Then the Shared Successfully windows will pop up and you can choose one of the sharing methods.
