How to Make a Gantt Chart in Google Slides
People use Gantt charts to record the project process and sometimes may need to present them for their superiors or team members. This tutorial would like to teach you how to make and present a Gantt chart in Google Slides with step-by-step instructions.
How to Make a Gantt Chart in Google Slides
Step 1: Select a Blank Layout
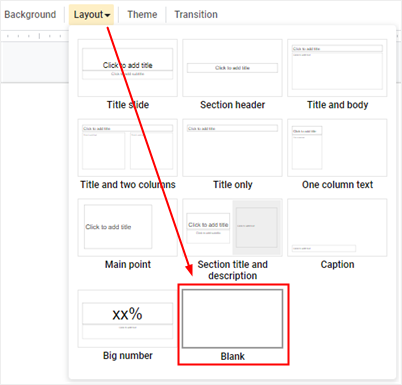
To better present the process of making a Gantt chart, click the Layout button on the toolbar, select Blank on the drop-down menu so that the slide will be a totally blank page without text boxes.
Step 2: Insert a Timeline Diagram
Navigate the Insert tab, click Diagram on the drop-down menu and the Diagrams pane will pop up on the right side.
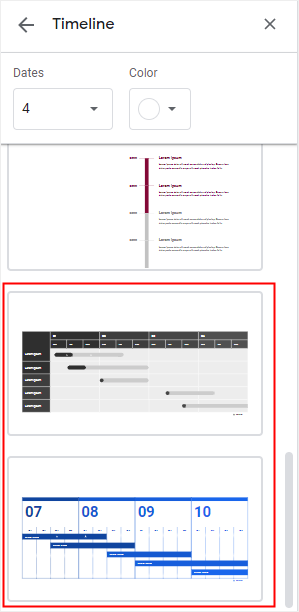
Why do we need to insert a timeline diagram in Google Slides? There is no pre-made Gantt chart in Google Slides, but you can find that two of the timeline templates in Google Slides look similar to simple Gantt charts.
Therefore, you can use these two templates and make your own Gantt charts. Click on the thumbnail and the template will be inserted on the slide.
Step 3: Fill Text on the Diagram
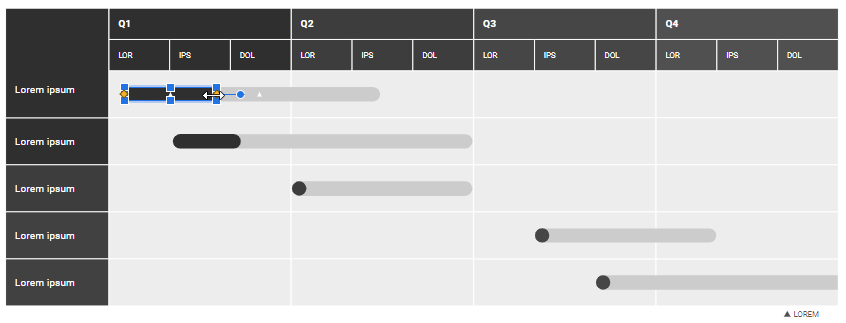
On the example diagram, you can just click on the boxes and type the text or data into them. Besides, to change the length of the black bar (usually means the task completion), select the black bar and drag the mouse when the cursor turns into a two-sided arrow.
Basically, you can make a simple Gantt chart in Google Slides in this way.
Step 4: Insert a Chart From Sheets
However, the first way will take you much time in inputting text and data into the chart. So if you have already recorded the project data, you can (read this tutorial) to process your data in Google Sheets and make it suitable for creating a Gantt chart.
When you get a Gantt chart in Google Sheets, go back to Google Slides, click Insert > Chart and choose From Sheets.
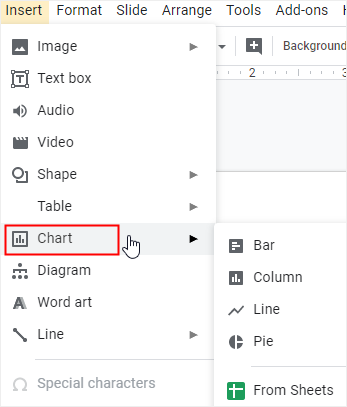
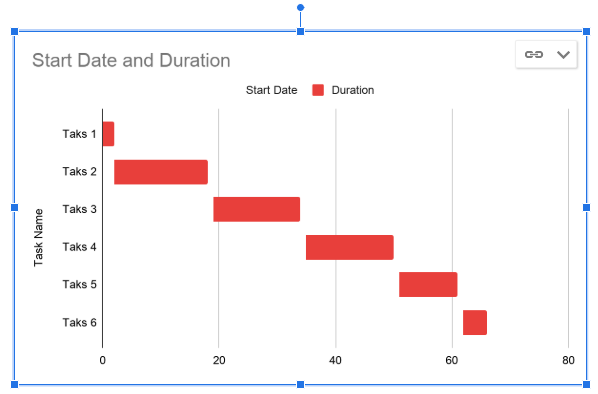
Follow the instruction and insert the Gantt chart into the slide. Every time you change the project data in Google Sheets, there will be an update button shown next to the link icon, you can click on this button to update your Gantt chart instantly.
How to Make a Gantt Chart in EdrawMax
If you wish to find a simpler and quicker way to make a Gantt chart, please see the below tutorial. You’ll learn how easy and efficient it is to use EdrawMax making Gantt charts with free templates, powerful drawing and data-import features.
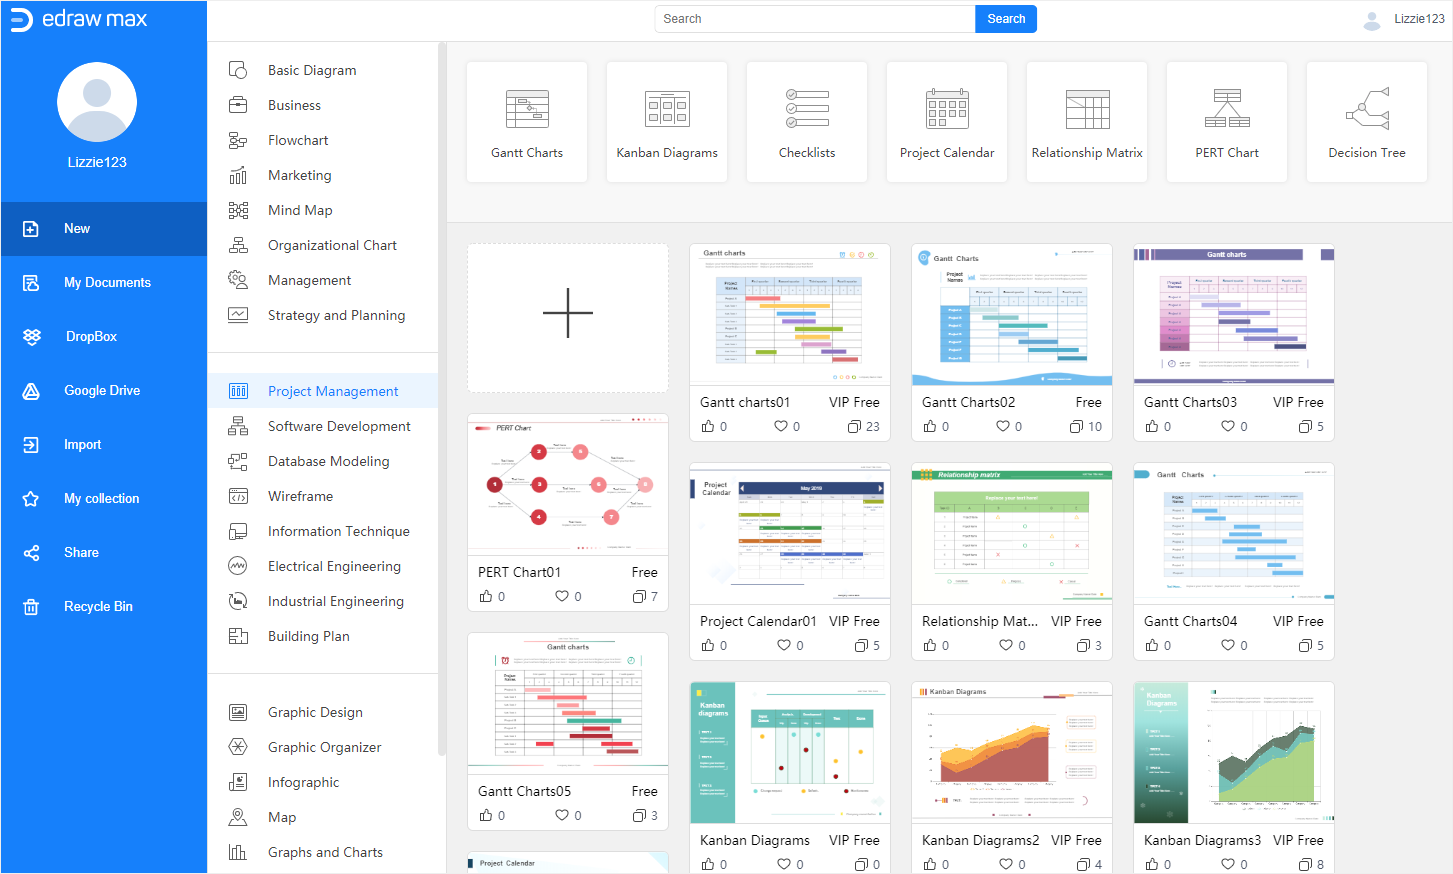
Step 1: Choose a Gantt Chart template in EdrawMax
If the Gantt chart you are going to make is for a presentation, we recommend you using the free Gantt chart templates in EdrawMax. Because these pre-made templates are more suitable for vividly showing project processes in a presentation.
Step 2: Open a Gantt Chart Template
Click on the thumbnail of the template, EdrawMax will open the template and display the Gantt chart on the main interface where you can edit text, change colors or replace elements.

Step 3: Import Data to Make a Gantt Chart
Apart from using a template, importing the project data into EdrawMax is also feasible and EdrawMax will auto-generate a Gantt chart based on the data.
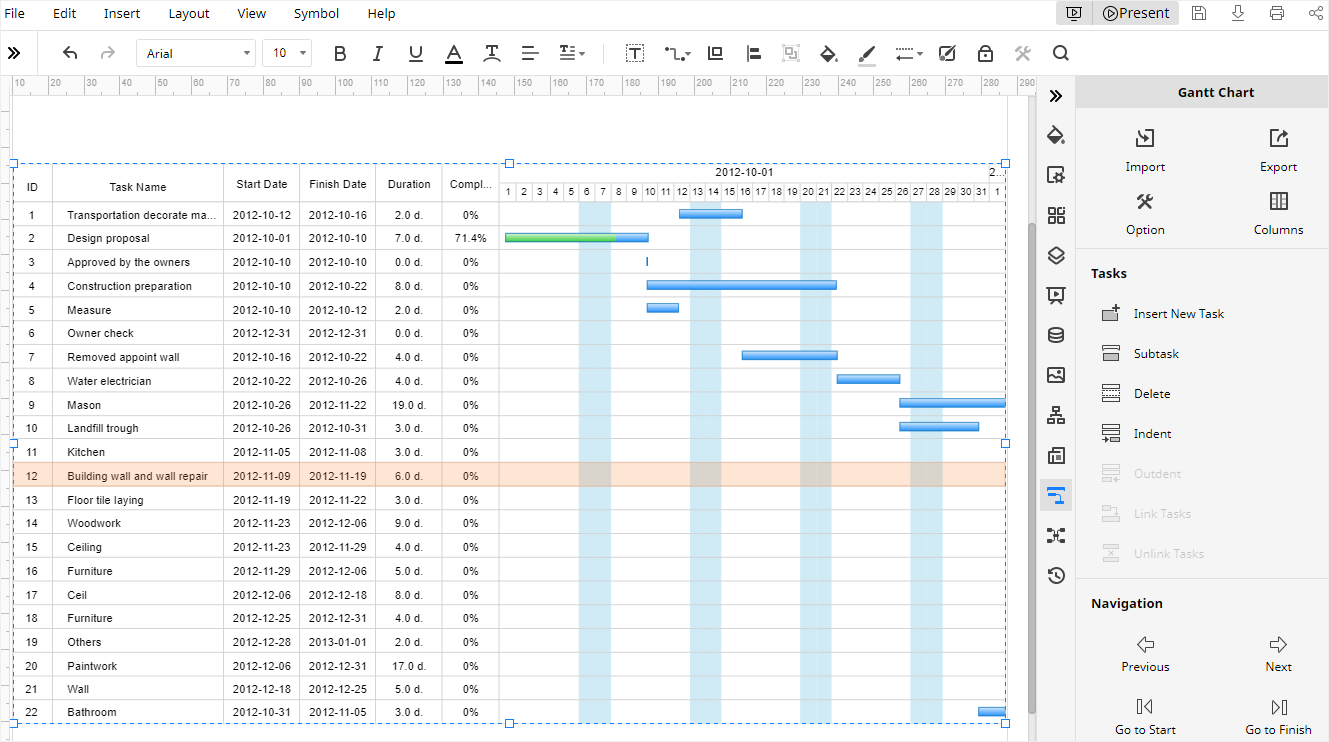
Click the Gantt Chart icon ![]() on the right sidebar, hit the Import button on the Gantt Chart pane, find the data file (XLSX or CSV) and click Open to let EdrawMax open the file and make a Gantt chart.
on the right sidebar, hit the Import button on the Gantt Chart pane, find the data file (XLSX or CSV) and click Open to let EdrawMax open the file and make a Gantt chart.
In this case, the Gantt chart looks like as shown below:
Step 4: Customize Your Gantt Chart
For using the Gantt chart template, the formatting tools on the Fill/Line/Shadow pane, Page Setup pane, and Theme pane will help you change the fill colors, line styles, shadow styles, page settings or chart themes.
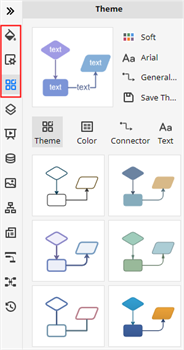
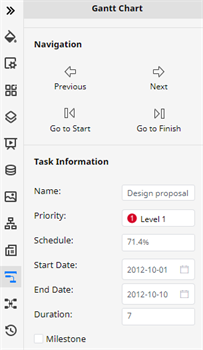
For importing task data, you can also use the formatting tools on the former three panes. But to modify task information, select the task, go to Gantt Chart pane, scroll to the bottom.
Step 5: Present Your Gantt Chart
To present the Gantt chart on EdrawMax, just click the Play button on the upper right corner of the main interface, then EdrawMax will display the current page in the full-screen mode.
To create slides based on the document, click on the Present button and start to make slides on the Slides pane.

For a team, strict project management is essential, and sometimes a clear image of the process and real-time adjustments are required. EdrawMax is a great Gantt Chart creator, and it also has a team version for file sharing, team management--memberships permission modifications. Learn more about EdrawMax business and how it can help you cut costs while creating Gantt charts.
How to Export a Gantt Chart to PowerPoint
You can choose to download Gantt charts you made in Google Slides in some common presentation or graphic formats.
Navigate the File tab, click Download and you can select Microsoft PowerPoint (.pptx) on the right menu. Google Slides will save the Gantt chart as a Microsoft PowerPoint file.
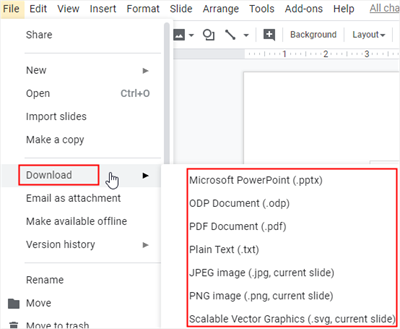
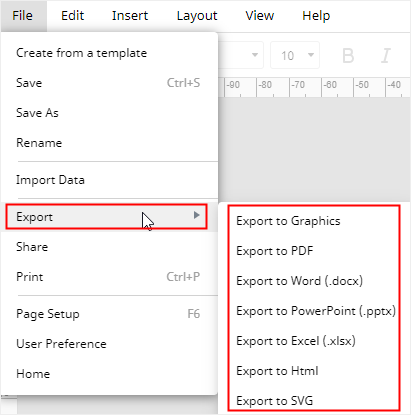
Similarly, you are able to export and download the Gantt chart in EdrawMax as well. EdrawMax also supports users to export Edraw diagrams for various file types like graphics (.png or .jpeg), PDF and MS Office file formats ( .docx, .pptx and .xlsx).
Hit on the File tab, select the desired file format on the right menu of the Export button.
Moreover, the exported MS Office files in EdrawMax are editable in the corresponding programs so that you can share your diagrams and charts with others, even if he or she isn’t an Edraw user.
Click on Save as button, choose to save your Gantt charts on the Edraw personal cloud, Google Drive or Dropbox.
