Quick Guide for EdrawMax Online
Looking for some help? Here you can get quick answers and step-by-step instructions on how to use EdrawMax Online.
EdrawMax Online Guide
-
Get Started with EdrawMax Online
-
Basic Shape Operations
-
Basic Elements
-
Format
-
Insert Object
-
Page Setting
-
Document
-
How to Create an Organizational Chart
-
How to Create a Floor Plan
-
How to Create a Gantt Chart
-
How to Customize Smart Shapes
-
EdrawMax App Guide
-
Video Tutorial
Insert Chart
To insert a chart, you can
- Go to Insert tab and choose Chart, or press Ctrl + Alt + A directly;
- In the pop-up Insert Chart window, choose the desired type of the chart;
- Click OK.
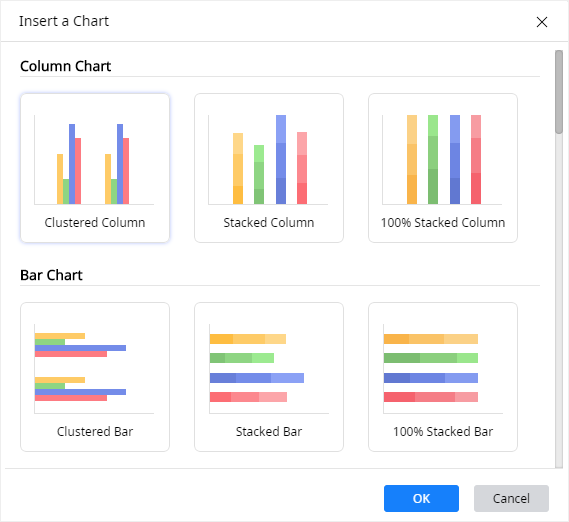
There are different types of pre-defined charts in Edraw Max:
- Column Chart
- Bar Chart
- Line Chart
- Area Chart
- Scatter Chart
- Radar Chart
- Pie/Doughnut Chart
- Gauges Chart
- Funnel Chart
To customize a chart, select the chart, then you can click Chart icon ![]() on the right sidebar.
on the right sidebar.
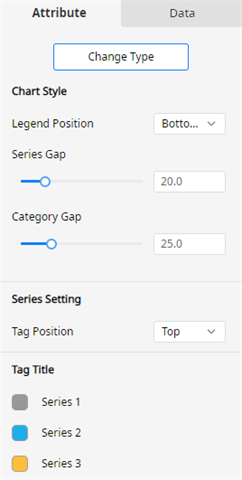
In the Attribute pane, you can click Change Type button to change the selected chart.
 |
 |
Once you insert a chart in the drawing page, the Attribute pane shows up and the options will have difference according to the type of the inserted chart.
The common options are:
- Chart Style
- Series Setting
- Tag Title
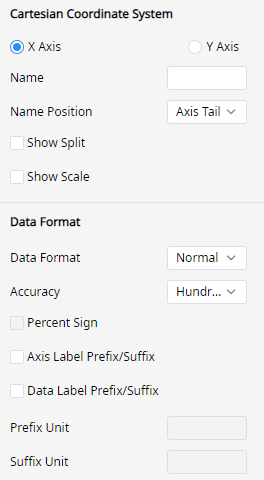
- Cartesian/Radar Coordinate System
- Data Format
In the Data pane,, you can
- Import data: click Import > Local Import to import the data file (.xlsx or .csv) that you need into the built-in worksheet.
- Export data: click Export to export the table into different types of files (.xlsx or .csv).
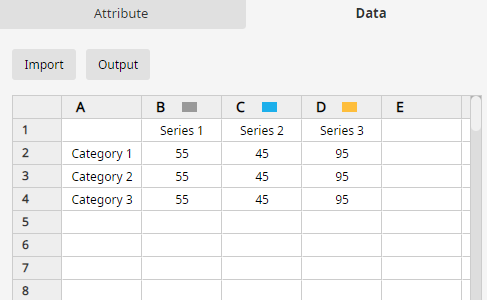
Apart from importing data, you can also input the chart data by double-clicking on the cells of the worksheet on the Data pane and typing numbers or text into them.


