A Quick-Start Graph Maker
Type your data and your graph is made!
The Magic of Graph

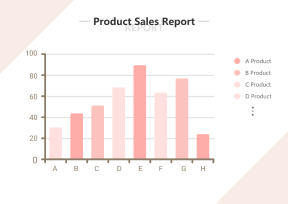
The graphs can make your content shown in a more simple and straightforward way, visualize data in a format that makes key information easy to understand in the shortest time in order to make your content better presented.

The business trends and result of data analysis shown by graphs can help decision-makers understand or compare from multiple perspectives. On this basis, decision makers can make more rational decisions accordingly.
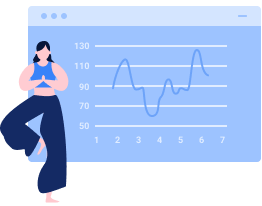
To illustrate the relationship of one changing parameter to another one, such as cardiovascular data over days or weeks, graphs of the recorded data can monitor your health status and abnormal parts in a timely manner.
Only 4 Steps to Create Your Graph

Step 1
Choose a graph template

Step 2
Type your data in embedded sheet or import your sheet

Step 3
Customize your graph in details

Step 4
Export and share your graph


The Simplest Online Graph Maker
Create Graph with Maximum Flexibility
• Select a graph template and change the data for your use, or switch the graph types as per your needs;
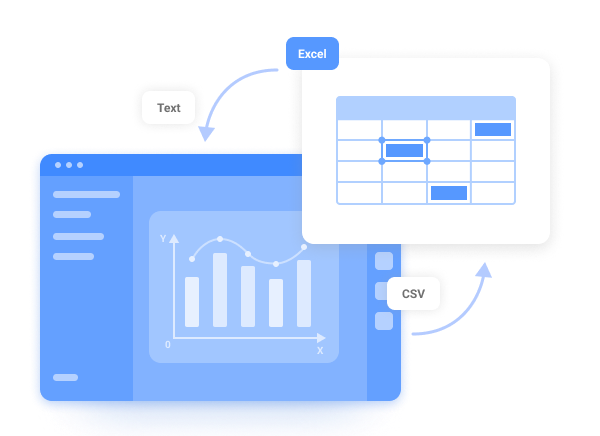
• Import your data as csv, text or excel file into your graph template, and the graph is updated automatically;
• Type your data into embedded sheet, and you can see the results of your changes instantly;
• Export the embedded spreadsheets in excel and csv formats to avoid data lose or repeating work.
Customize Graph with Minimal Efforts
• The artful libraries offers you a place to play around with diverse symbols, icons, shapes and beyond;
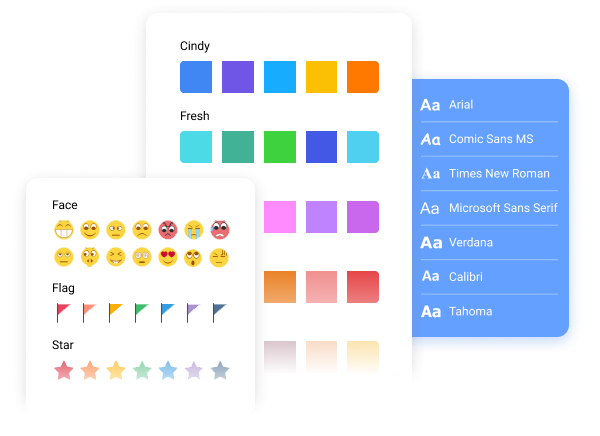
• The professionally-designed color palettes, fonts and backgrounds add excitement to your creation;
• The smart data-layout enables to show or hide the each elements in graph, like the legend, label and axis name;
• The multiple graphs in canvas to enhance your presentation, or insert anythings as creative as you like.

Export and Share Graph with One Click
• Export your graphs in multiple formats, including Graphs, PDF, HTML, Visio and more, then embed it in your report;
• Share or email your graphs with your colleagues and friends on social media, like Facebook, Twitter or Pinterest;
• Print your graphs with highest quality, and take it to your presentation for better showing your work;
• Present your graphs directly from EdrawMax, just use the presentation mode in the upper navigation panel.
Frequently Asked Questions in EdrawMax
-
1. How much does it cost to create a graph in EdrawMax?You don't have to pay. You are free to create any types of graphs. Just create your first graph in EdrawMax now, and we believe that you will love it!
-
2. Can I create the graphs online?Absolutely yes! Use EdrawMax to create your graphs in every scenario you can think of, online or offline. EdrawMax will always be there for you!3. Can I change the type of graph after inputting my data?Of course, you can switch different types of graphs smoothly after typing or uploading your data, and the data-layout in your graph changes accordingly.4. Is my data safe when using EdrawMax?100% security guarantee! All information and file transfers are safeguarded with the highest level of SSL encryption.5. What if I want to know more about wireframe?Check out our Resource Center
Explore More Graphs Templates
Reviews from Our Users
More Than A Graph Maker
EdrawMax is more than a graph and chart maker, there are 280+ types of diagrams for you to create with ease!
All-in-One Diagramming Tool
EdrawMax is committed to optimizing features to satisfy your needs continually, and further build powerful all-in-one diagramming tool over the world. Just try it, you will love it!

