How to Make a Pie Chart in Google Sheets
Google Sheets is noted for a web-based spreadsheet application that allows users to create, share and modify sheets online. It’s also convenient to make your own pie chart in Google Sheets and in this tutorial, we will show you how to do this with step-by-step instructions
How to Make a Pie Chart in Google Sheets
In the beginning, you should sign up for a Google account. Then you can follow these instructions and add a pie chart to a Google spreadsheet document.
1. Search Google Sheets and open a new spreadsheet on your browser.
2. Paste or type your data into the spreadsheet, select all the data and titles, and navigate to Insert > Chart to open the Chart editor
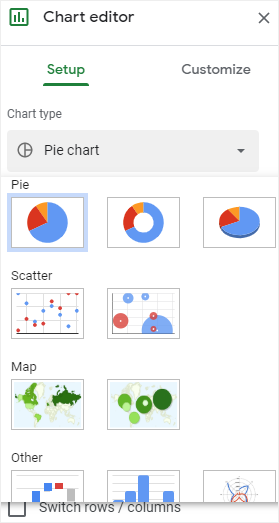
3. You can select a pie chart type that you like on the menu. Usually, an example pie chart will appear on the spreadsheet. Because Google Sheets auto-creates a suitable chart based on your data.
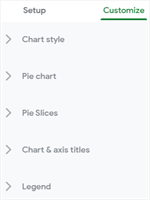
4. To customize your pie chart in Google Sheets, go to the Customize tab on the Chart editor pane where you can change chart styles, alter slice colors, add or delete chart titles and legend.
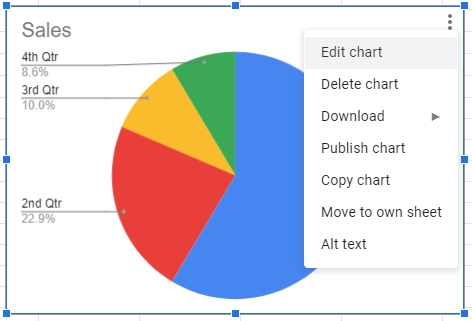
5. Click on the 3 vertical dots in the pie chart, select Edit Chart to reopen Chart editor In the meanwhile, you can choose to delete, download, publish, copy or move the selected pie chart diagram in Google Sheets.
How to Make a Pie Chart in EdrawMax
If you have tried EdrawMax before, you will know that EdrawMax performs pretty well on creating graphs, charts or another type of diagrams that Google Sheets can not make, including flowcharts, UML diagrams, Network diagrams, P&ID, Gantt charts, etc.
To draw a pie chart diagram with your data in EdrawMax, like that in Google Sheets, here are the procedures of how to do this.
1. Open a new drawing page by clicking on the plus icon in the Home page, or add a blank page in an Edraw file that you want to insert a pie chart.
2. Select Insert > Chart and choose the default Pie Chart in the Insert Chart dialog box.
3. Input your data into Chart (Data) pane and your pie chart will show up on the drawing page automatically.
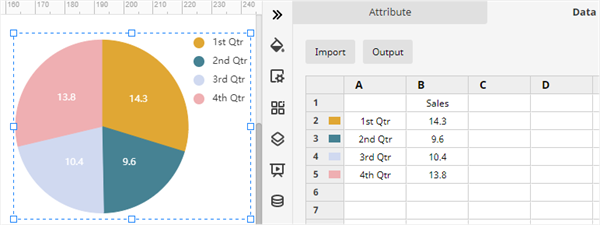
4. You can change chart colors, chart types or data settings in Chart (Attribute) EdrawMax also allows users to make exploded pie charts.
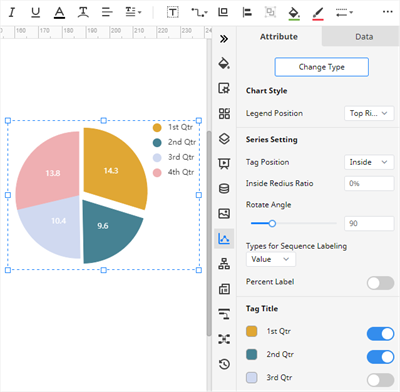
5. A lot of formatting tools in EdrawMax for changing fill colors, applying quick styles and alter diagram themes, etc., are lying on the toolbar and the first three right-side panes.
On the other hand, EdrawMax also provides thousands of pre-made templates in the application and Edraw Tempalte for different kinds of diagrams and charts. So it’s possible for users to create a stunning and professional-looking diagram or chart in just a minute.
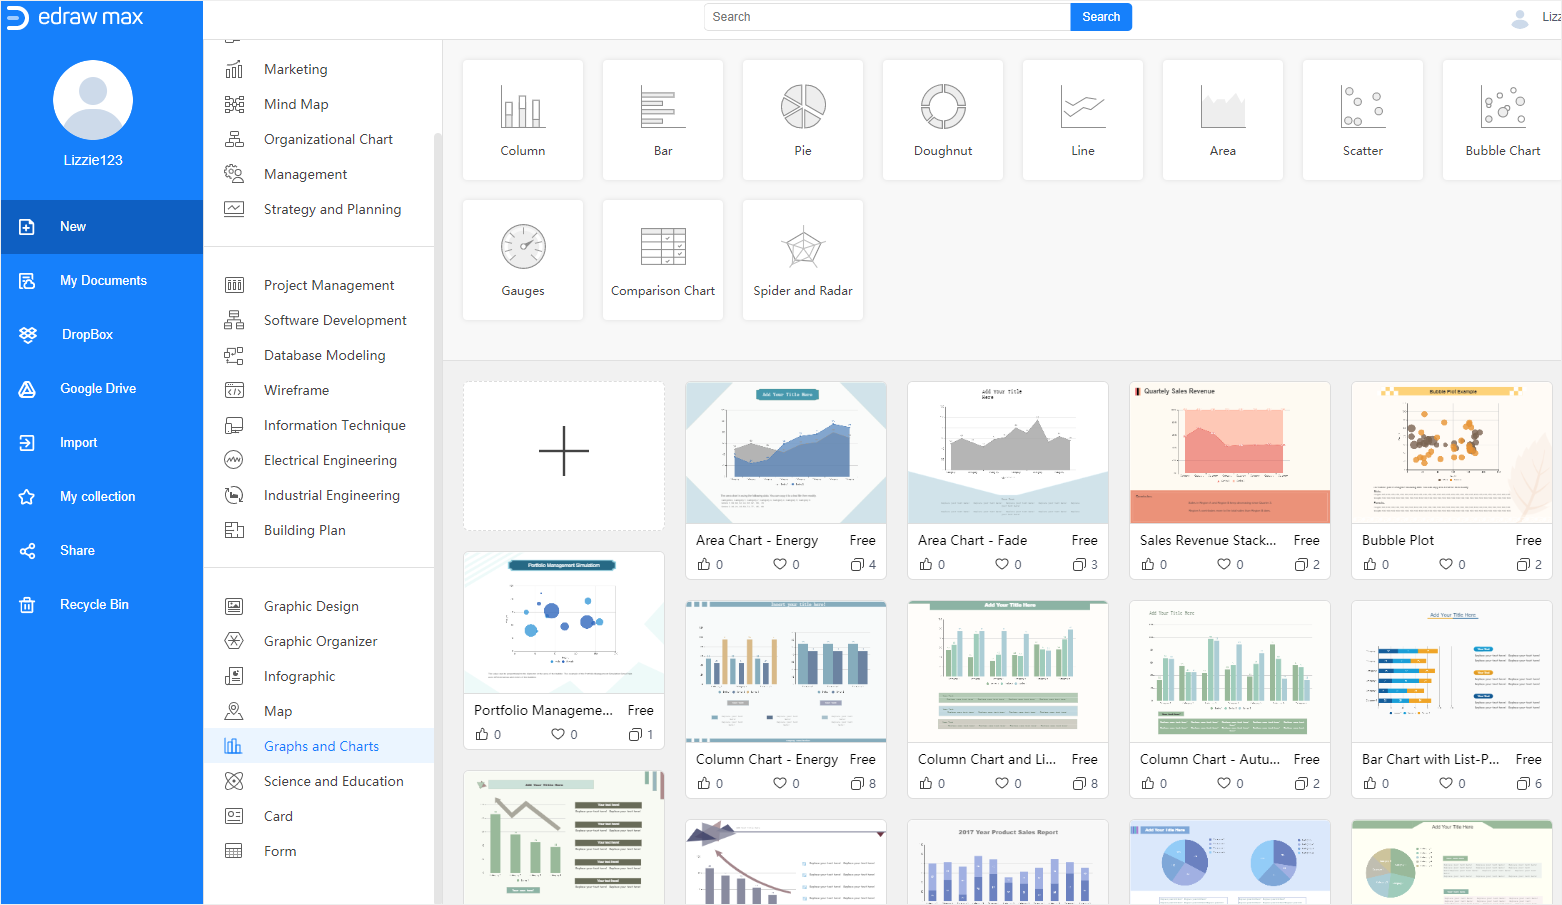
To know how to use a pie chart template in EdrawMax, you can follow the steps below:
1. Create an Edraw account, and open (EdrawMax Online).
2. Select Graphs & Charts on the diagram type list, choose a pie chart template that you want to use and click to open it.
3. Edit text and customize this template with formatting options mentioned above.

4. Once your pie chart is finished, click on the Play button on the upper right corner, and EdrawMax will present your pie chart diagram in a full-screen mode so that you can check whether there are defects and mistakes in the chart.
How to Export an Edraw Chart as Common Files
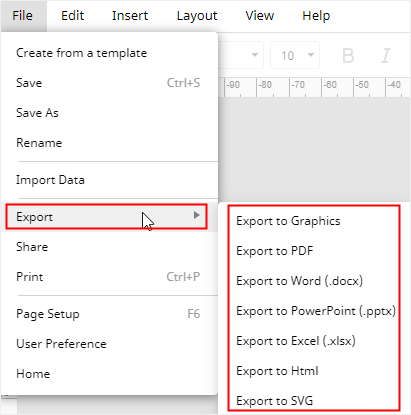
In Google Sheets, you can choose to save and download your pie chart in worksheet-related formats, including XLSX, ODS, PDF, CSV, etc.
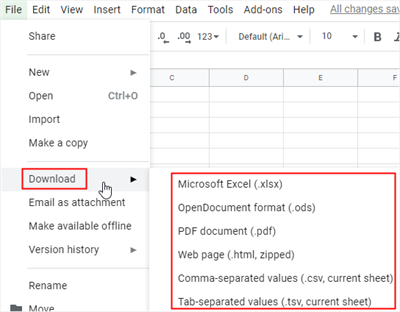
EdrawMax is also a web-based application that allows users to create, modify and share diagrams and charts online. It supports to export your diagrams in the formats of Microsoft Excel and other common file types.
As the exported MS Office files are editable and printable in corresponding programs, you are able to edit, transmit or share your files with your partners or friends who may not be Edraw users.
