How to Make a Radar Chart in Excel
A radar chart is used to display multivariate data in a 2-dimensional form. When we have multiple quantitative variables, a radar chart is the best solution to display the data graphically. The variables' starting point is the same on the axes. A radar chart is also called a Spider chart. Making a radar chart is a bit tricky, but you can quickly learn how to create a radar chart in Excel.
This article is a helping guide about how to create a radar chart in Excel and EdrawMax online editor. Let's continue to learn how to create a spider chart in Excel.
How to Make A Radar Chart in Excel
Step 1:
First of all, open Excel on your computer.
Step 2:
After opening the Microsoft Excel on your computer, insert the data into the spreadsheet for which you want to create a radar chart.
If you have an Excel file saved on your computer which you want to use for creating a radar chart, then click the File tab on the upper left corner of the Excel. Next, click the Open tab. Go to the location where your file is placed and select the file and click the Open button.
Step 3:
Insert the data or open the Excel file to create a radar chart in Excel. In case you have inserted your data in the sheet, select the data range using the cursor for which you want to draw a radar chart.
Step 4:
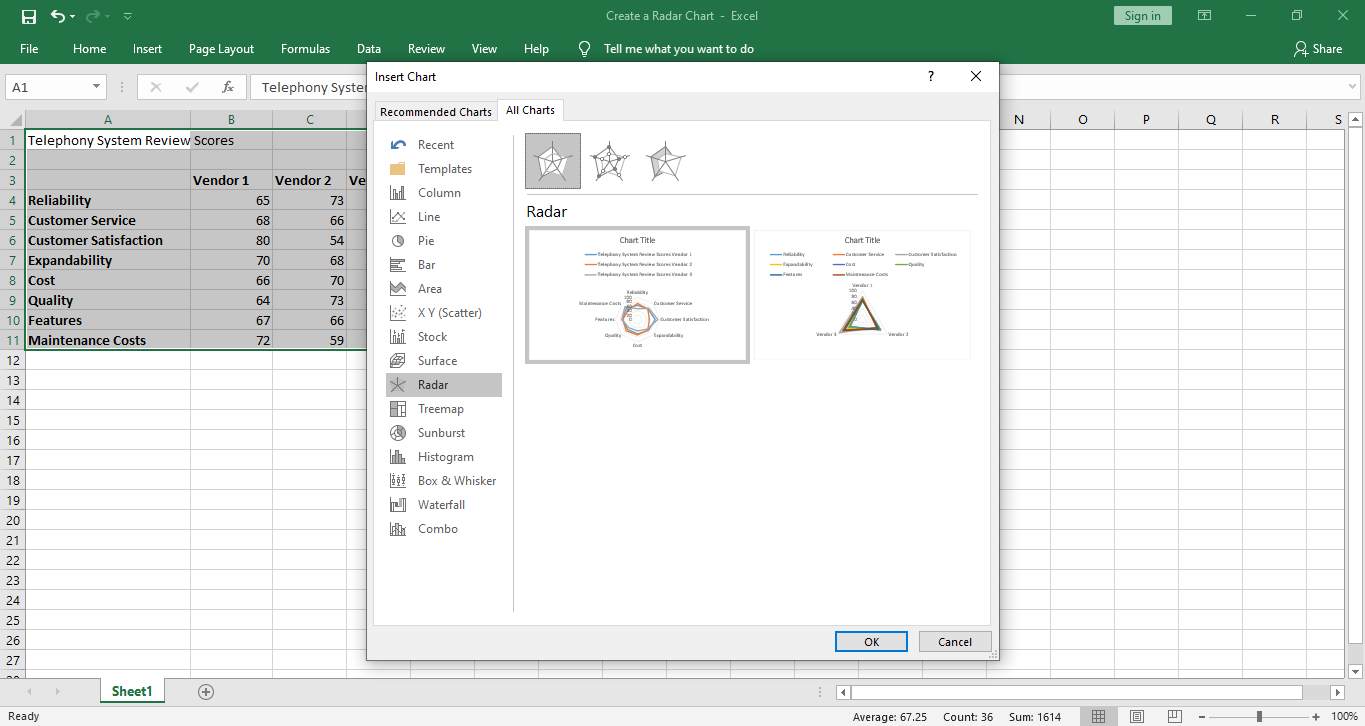
Click the Insert tab after selecting the data in the sheet. From the Insert menu, go to the Chart section and then click on the small downward pointing arrow.
You can see the dialogue box in the image below.
Step 5:
From the dialogue box, move to the All Charts tab. Go to the Radar tab and select a Radar Chart from the collection of different types of radar charts and then click the OK button.
The radar chart will appear in the worksheet alongside referenced data. You can see the radar chart for the selected range of data in the image below.
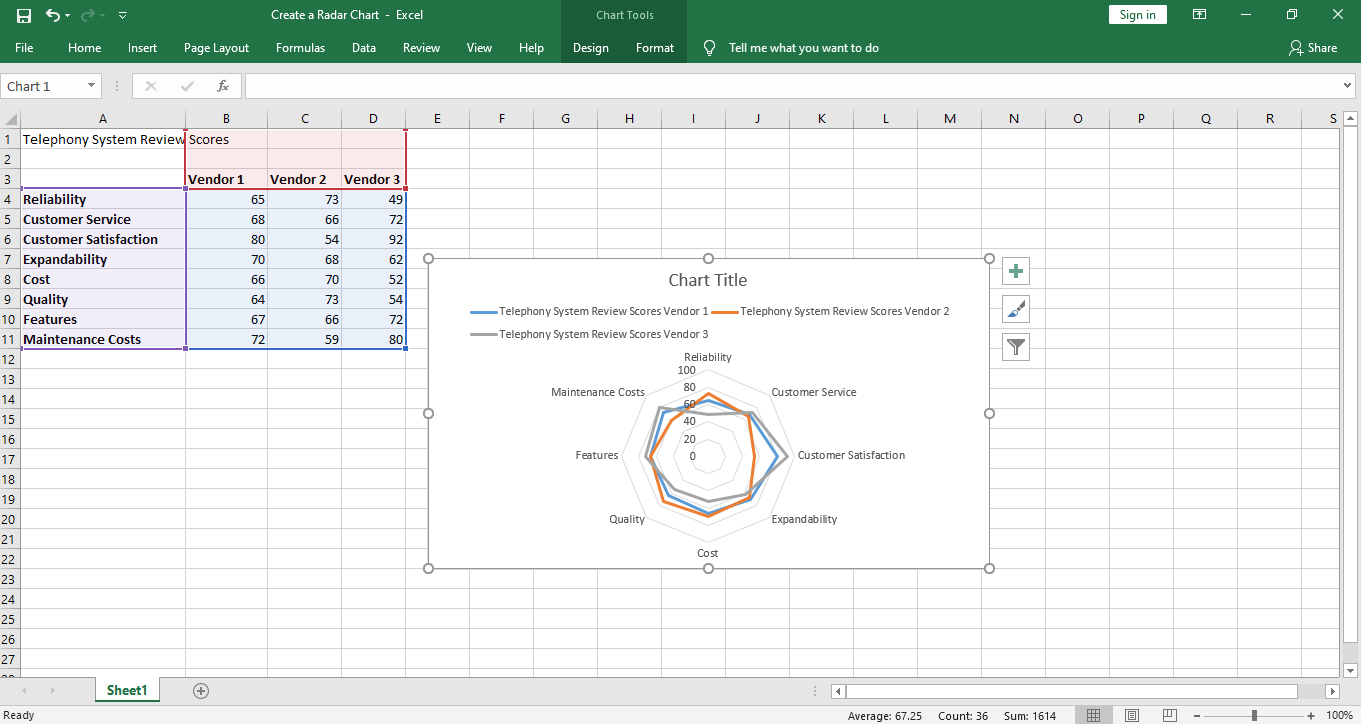
You can find different types of Radar Charts in Excel. There are three types of radar charts in Excel. First, there is a Simple Radar Chart, then you have the option to select a Radar with Markers and the third option is Filled Radar.
How to Make A Radar Chart in EdrawMax Online
Step 1:
Log in to your EdrawMax account. EdrawMax is an online tool for graphics designing and can be used to create a Radar Chart.
Step 2:
Click the New tab just below your Email address. From the New menu, select the Graphs and Charts tab. You can see the Graphs and Charts menu in the below picture.

Step 3:
From the Graphs and Charts menu, select the Spider and Radar tab. Some Radar and Spider chart templates will appear. Alternatively, you can create a radar chart from scratch by choosing the large + sign.
You can see a Radar Chart template revamped in the EdrawMax online editor in the image below.

Step 4:
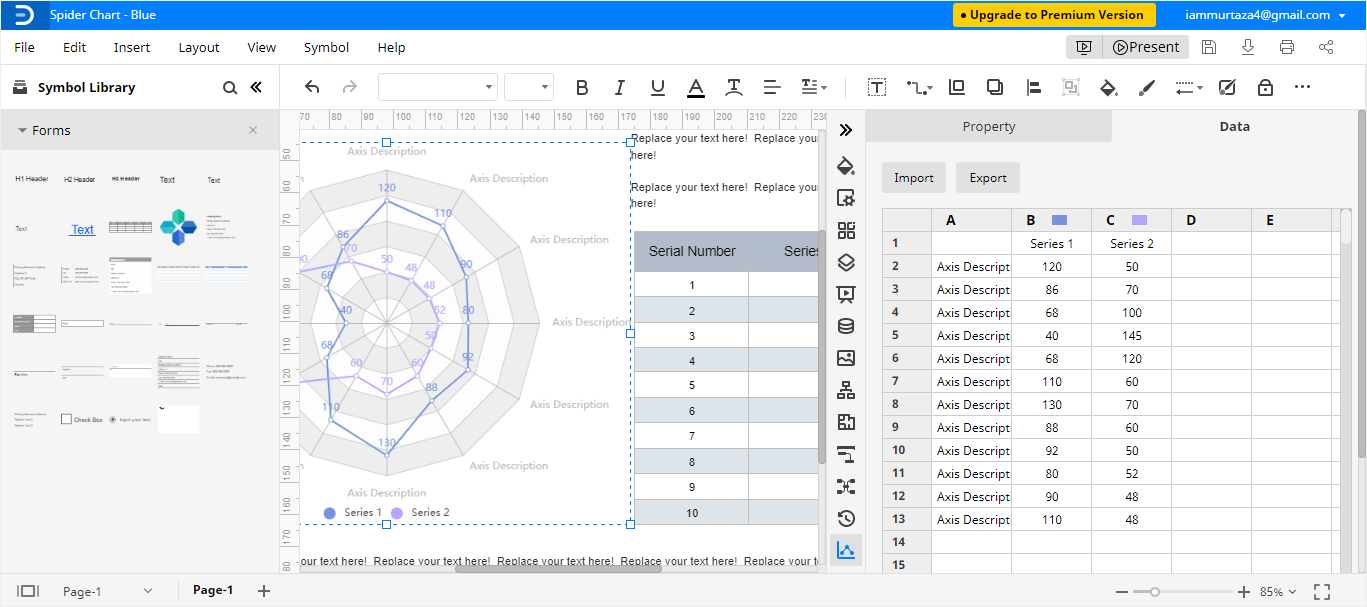
You can edit the Radar chart in the editor window. The template has some pre-set data values, and therefore, you need to replace the values with your data so you can make it according to your requirements.
On the right side of the window, click the Data tab and insert your data in the sheet. You can add more variables if you want or you can remove the variables. From the Change Type tab, you can change the chart type as well.
How to Export an Edraw Chart as An Excel File
After you have created your Radar Chart in EdrawMax, you can save it in different formats. If you want to save your Radar Chart in Excel format, it is an easy process of two steps. Follow the below steps to save your radar chart in Excel format.
Step 1:
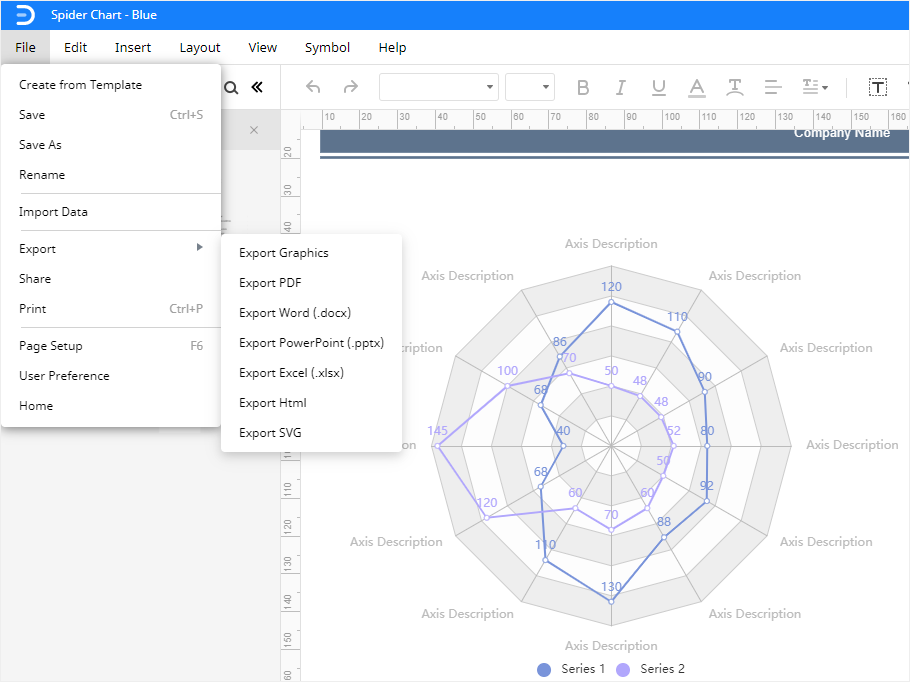
Click on File in the top left corner, and then from the drop-down menu, select Export.
Step 2:
From the Export menu, select Export to Excel (.xlsx), and your radar chart will be saved as an Excel file to your computer. You can save export your Edraw files to Dropbox and Google Drive as well. You can see the Excel format option in the image below.
