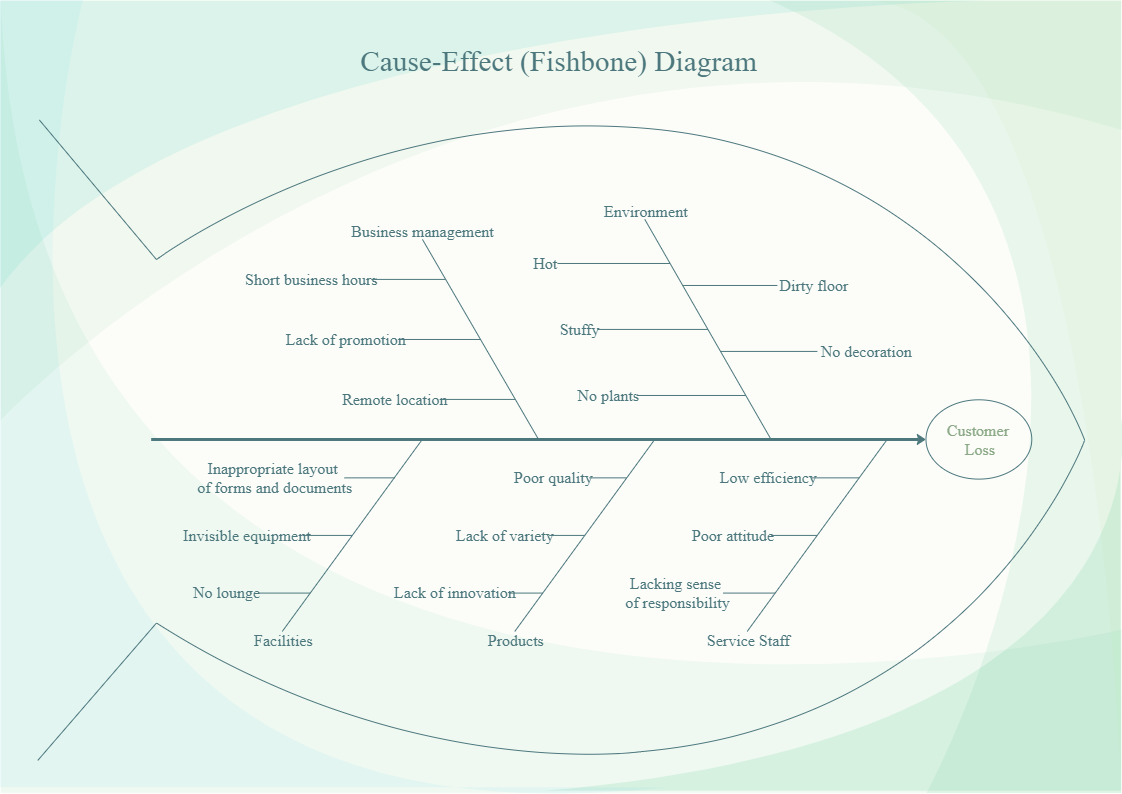
A fishbone diagram is also known as a cause and effect diagram. It is a tool used to visualize all the potential causes of a problem in order to discover the root causes. A customer loss fishbone diagram shows different causes of pain that may lead to a customer’s dissatisfaction and eventually cause problems to the company or the organization. As per the image, the fishbone diagram technique combines brainstorming and mind mapping to discover the cause and effect relationship of an underlying problem. It pushes one to consider nearly every possible cause of an issue instead of just getting stuck on the most obvious ones. Use EdrawMax or EdrawMax Online to create customer loss fishbone diagrams and analyze what can go wrong that would lead to a customer’s loss.


 Desktop