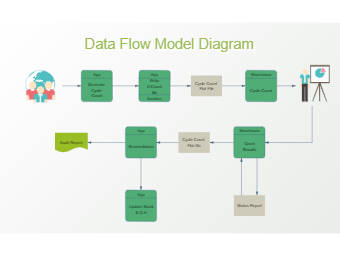
A Data Flow Diagram (DFD) is a graphical representation of the flow of data through an information system, modeling its process aspects. As the data flow diagram example suggests, data-flow diagrams show the functions of the system, state-transition diagrams show the timings in the system, and entity-relationship diagrams show the data relationships. A DFD diagram, also known as the Bubble chart, process model, business-flow model, workflow diagram, or function model, is good for displaying the functions of a system but not good for modeling databases or time-dependent behavior. Use EdrawMax or EdrawMax Online to create a data flow diagram example template for personal or professional usage.