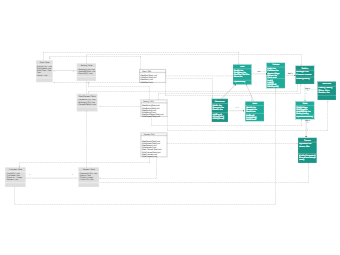
The below process Event chart shows the entire process or the lifecycle of how the customers create their profile and initiate the payment to complete the ticket process. In the DAM Design below, tables like Payment, Tickets, BookTicket, Booking, Customer, Event, Management, Admin, Payment: DAM, Payment Table, Customer table, Event Table, BookPayment table, Booking Table, and others play an important role. As shown here, Event (EventID: Char, EventName: Chart, EventTime: DataTime) has Customers (CustID: Char, CustName: Char, PhoneNumber: Integer, Address: Char, Event: event) does Booking (BookingId: Char, Customer: customer), which leads to Tickets (TicketId: Integer, TicketType: char, AvailableTicket: char, Booking: booking) that further leads to Payment (PaymentId: Char, Amount: float).