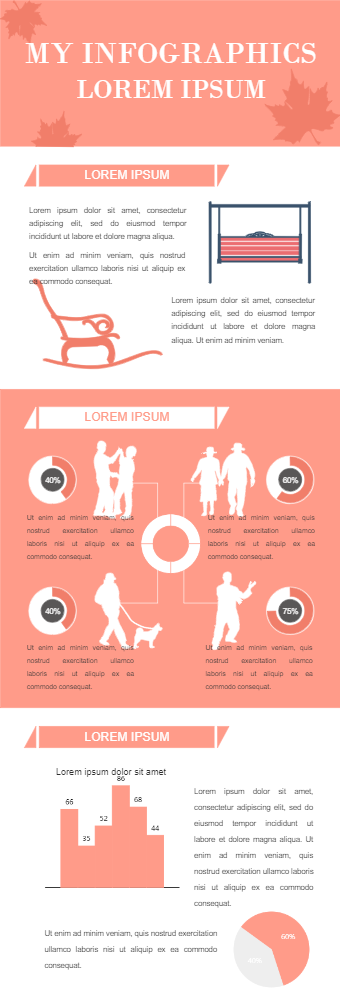
We have an infographic related to old age that can be used to elaborate on the topic. Then we have different old age activities infographics to talk about types of activities that seniors usually engaged themselves in to keep them busy, healthy, and active. We also have a progressive circle chart to show the percentages of people engaging in these recreation activities. The infographics used provide an insight into old age life. Then we have a simple bar chart to show the number of seniors in each activity. In last, we have a pie chart to show percentages of old age people who either take part or not at all in any recreation activity. The perfect infographics with beautiful charts and color combinations for visually presenting the idea. These infographics can be used by old age centers to show old age life and how it can be made better by taking part in recreational activities.