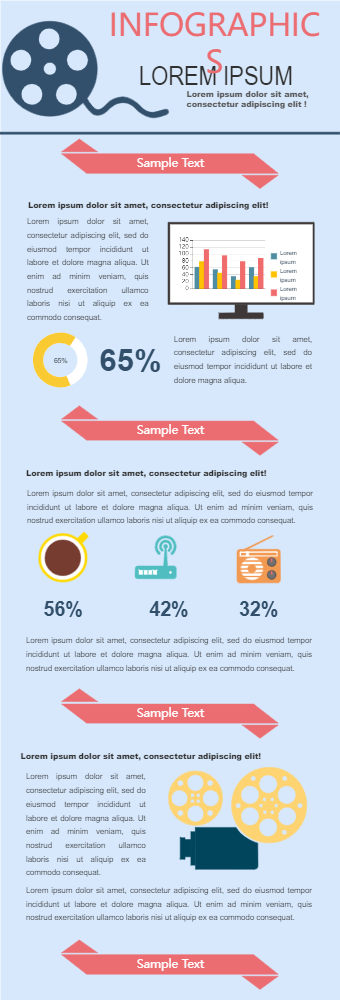
This infographic has a catchy headline and color combination to grab immediate attention. Then it has a cluster bar chart. It can be used to compare relative data such as the number of males, females, and children audience in the last few years. This will help compare data over an extended period of time. It also has a progressive circle chart to show the collective audience percentage of the entertainment industry. Next, it has infographics with different sources of entertainment such as radio, internet, etc, and their relative percentages. This section can be used to show the popularity of each source. This infographic can be used by entertainment industry businesses or agencies to compare the growth of different sources of entertainment over a period of time.