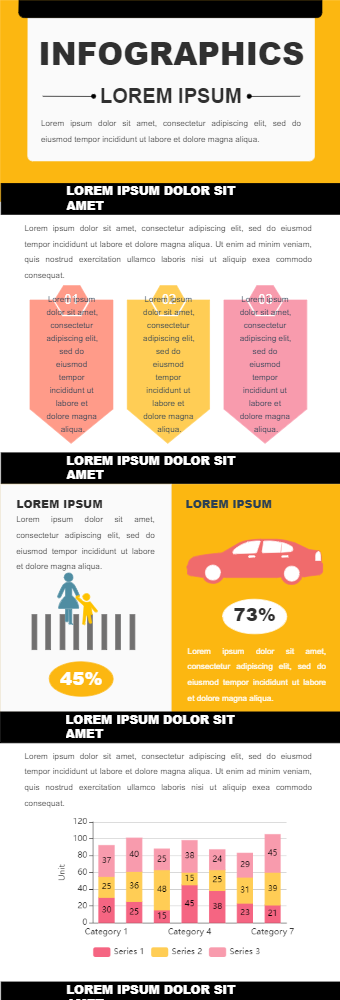
This infographic is a transportation infographic. Graphics can be used to compare the percentage of road accidents caused due to pedestrians or motor vehicles. A very beautiful opening to catch the reader's attention. The color combination and theme fit the concept nicely. It complements the subject perfectly. The next section has a stacked bar chart that can be used to show various age groups such as pediatric, adult, and elderly involved in these accidents. The next section contains symbols of traffic rules, it can be used to talk about the reasons for these accidents. In the end sections table, which can be used for analysis of things such as age, speed, land width, etc. for better understating of the matter. These infographics can be used by teachers to help understand the contribution of different factors to a road accident in a visually