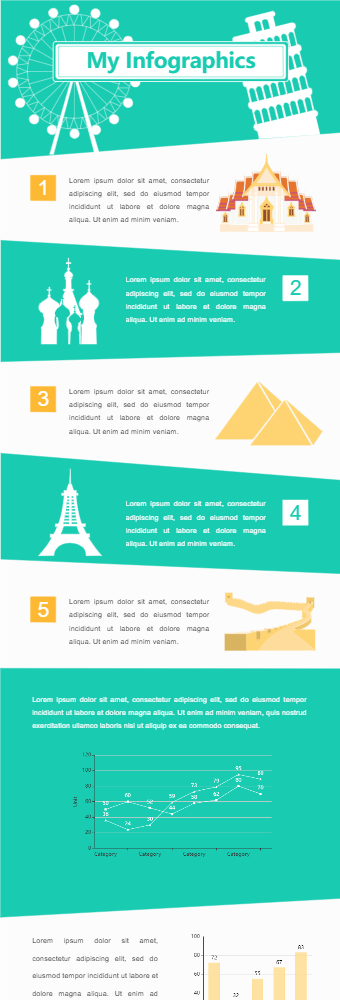
This architecture infographics show different architectural wonders including buildings, towers, pyramids, China wall and temples. It can be used by teachers to describe different architectural forms to their students. They can describe the different architectural principles using the examples. Secondly, they can also use it in geography class for describing architectural wonders in different parts of the world.
It also has two statistical artifacts i.e. a graph and a bar chart. Users can depict different types of data here related to the topic. For example, they can show the historical timespan spent, the labour spent and the material used. The graph can show the comparison against different parameters. It can even be used as a timeline if required.