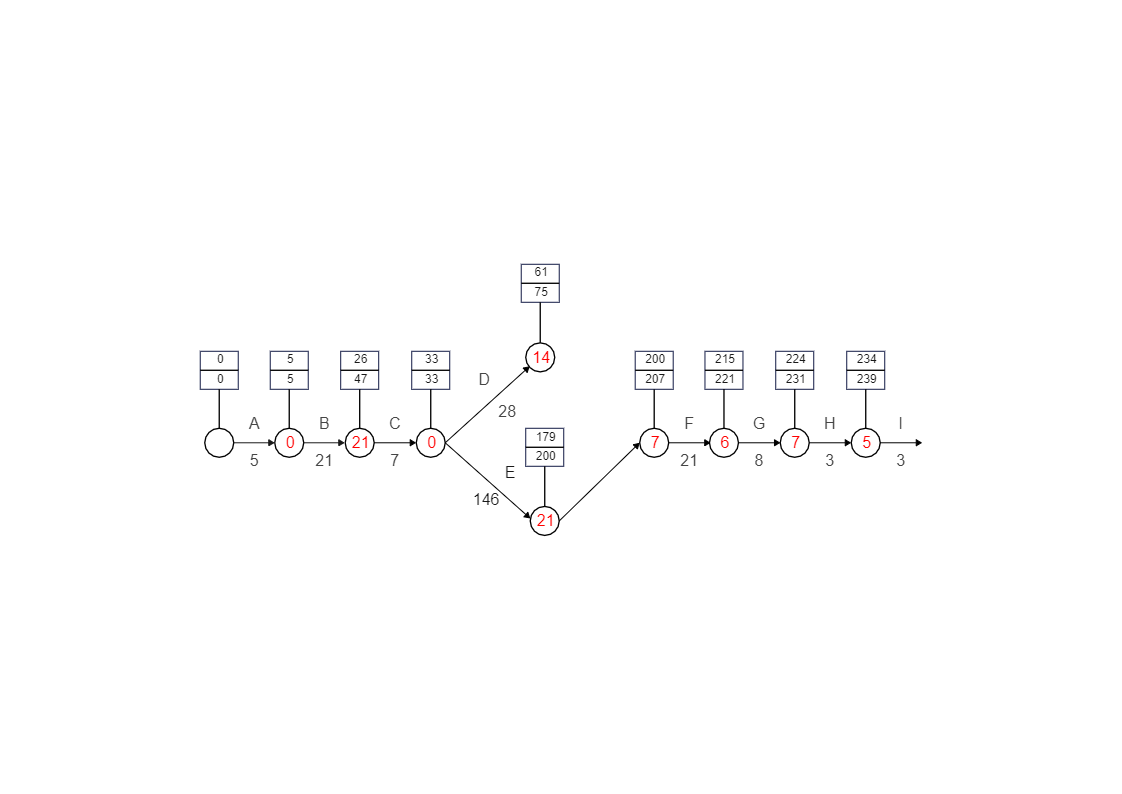
A PERT chart provides a graphical representation of a project's timeline that enables project managers to break down each task for analysis. The Simple PERT Chart illustrates that a PERT is a project management technique whereby planning, scheduling, organizing, coordinating, and controlling uncertain activities are done. As represented here, the PERT chart uses circles or rectangles called nodes to represent project events or milestones. These nodes are linked by vectors or lines that represent various tasks. You can use EdrawMax Online to create a similar-looking Simple PERT Chart diagram for your project. In simpler words, PERT provides a visual representation of a project's timeline and breaks down individual tasks.