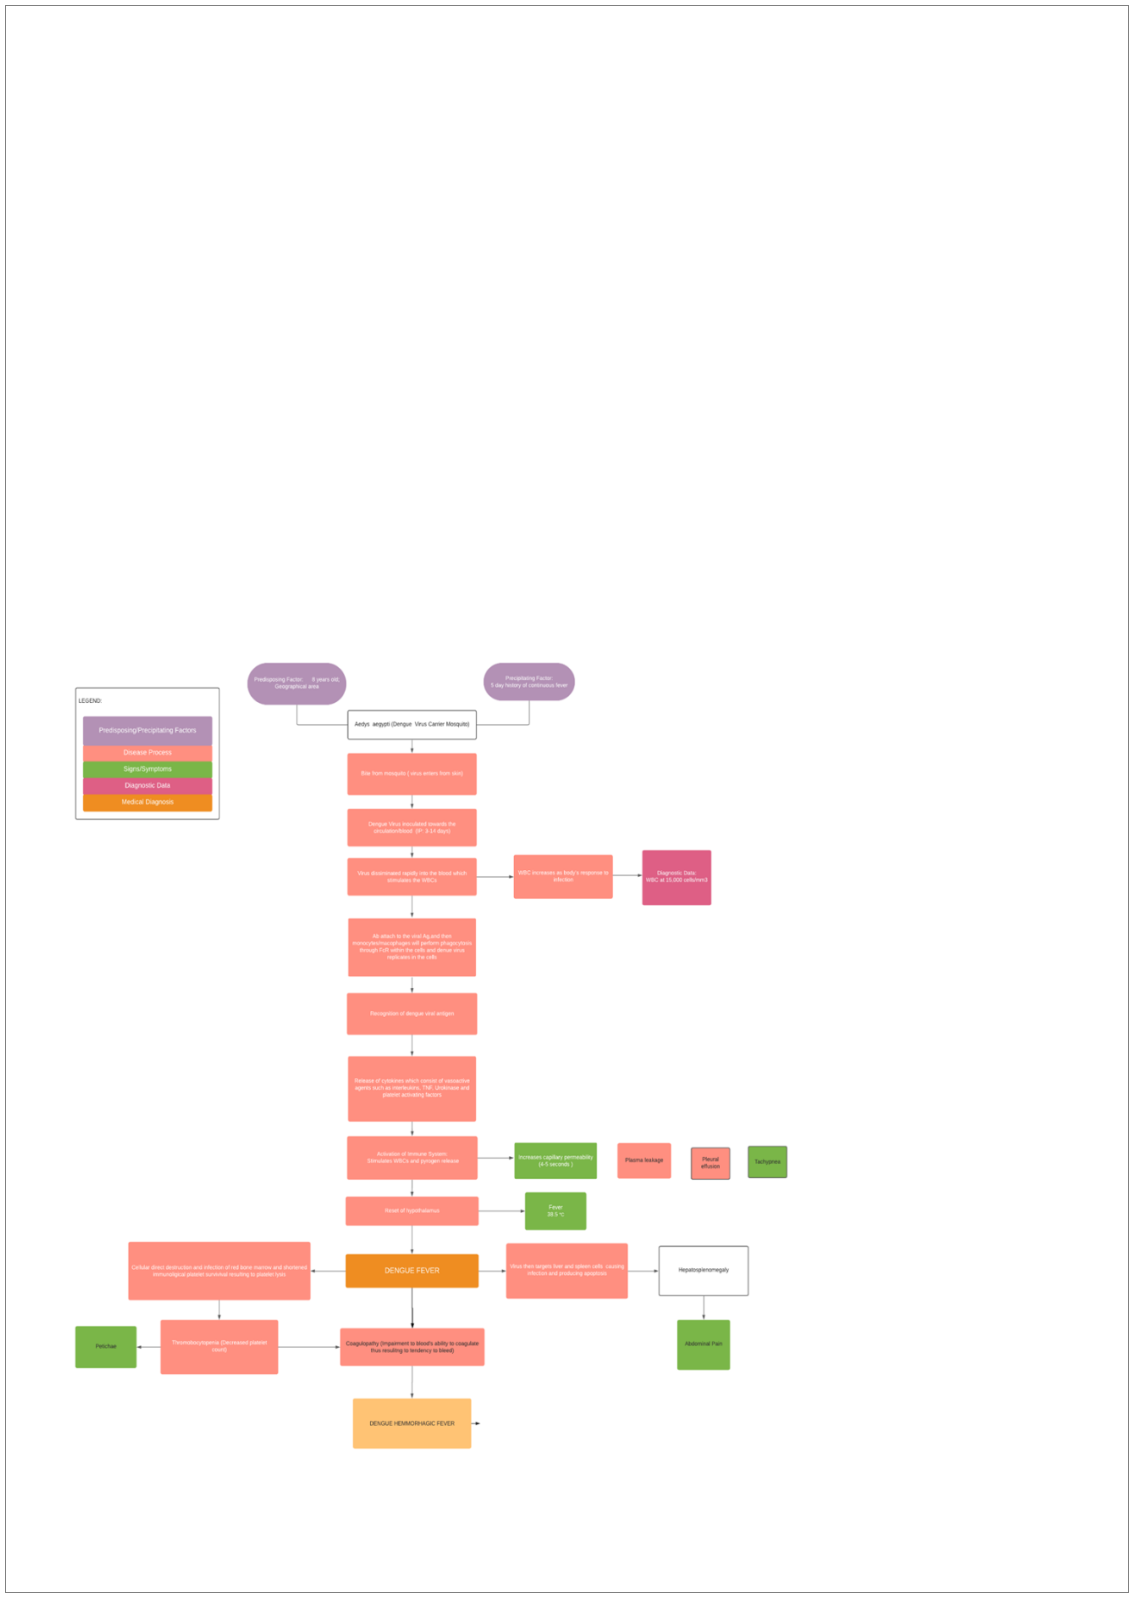
Concept maps are visual representations of information. They can take the form of charts, graphic organizers, and tables. In some examples, concept maps can have a combination of T-charts, timelines, Venn Diagrams, and even Flowcharts. The below concept map is created to educate the students about Dengue Fever. As the concept map illustrates, Dengue fever is a mosquito-borne tropical disease caused by the dengue virus. Symptoms typically begin three to fourteen days after infection. These may include a high fever, headache, vomiting, muscle and joint pains, and a characteristic skin rash. Recovery generally takes two to seven days. You can use EdrawMax Online to create a similar-looking Concept Map diagram for your usage.