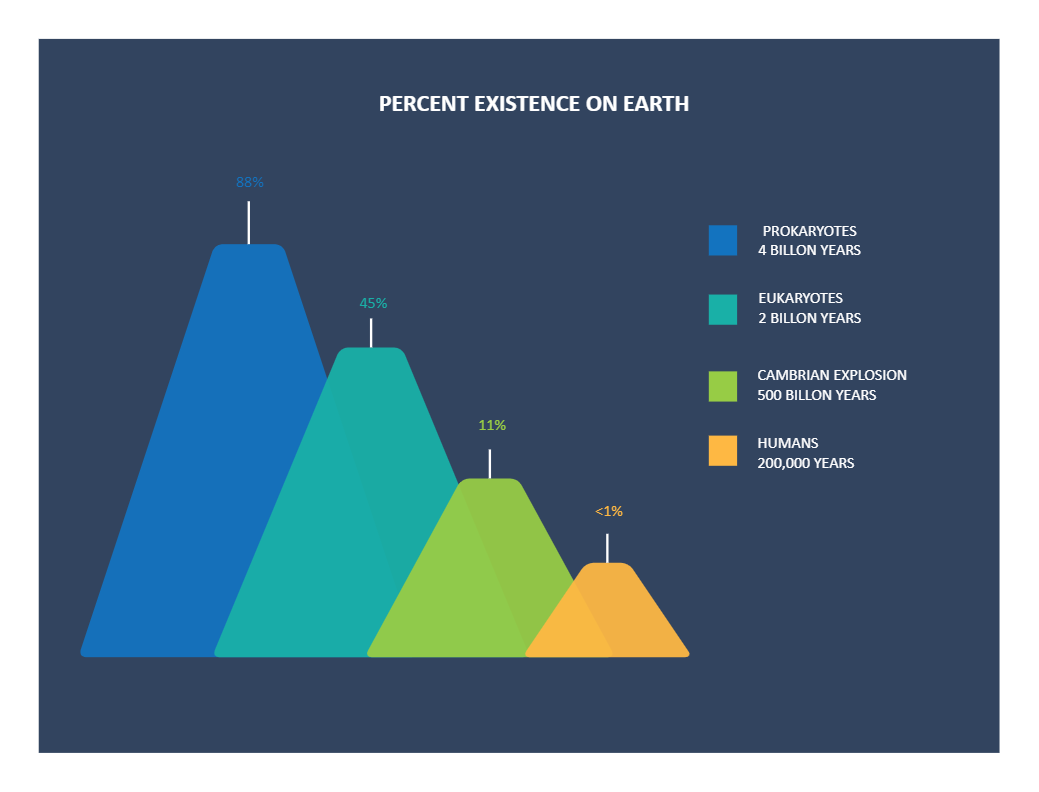
The below timeline diagram showcases the graphical representation depicting the percent existence on planet Earth. As illustrated, Prokaryotes were on Earth for 4 billion years, covering 88%. Whereas, Eukaryotes were on Earth for 2 Billion years, covering 45%. At the same time, the Cambrian Explosion happened over 500 million years ago, covering 11%. As depicted, Humans have been on Earth for the last 200,000 years, covering less than 1% of the timeline chart. It should be noted here that a timeline diagram consists of a graphical line representing time progressing from left to right or right to left (depending upon the region). As the below graphical illustration depicts, this graphical chart is marked with events or steps to indicate when a particular thing actually happened. Learn more from this timeline, and try to make yours with ease now!