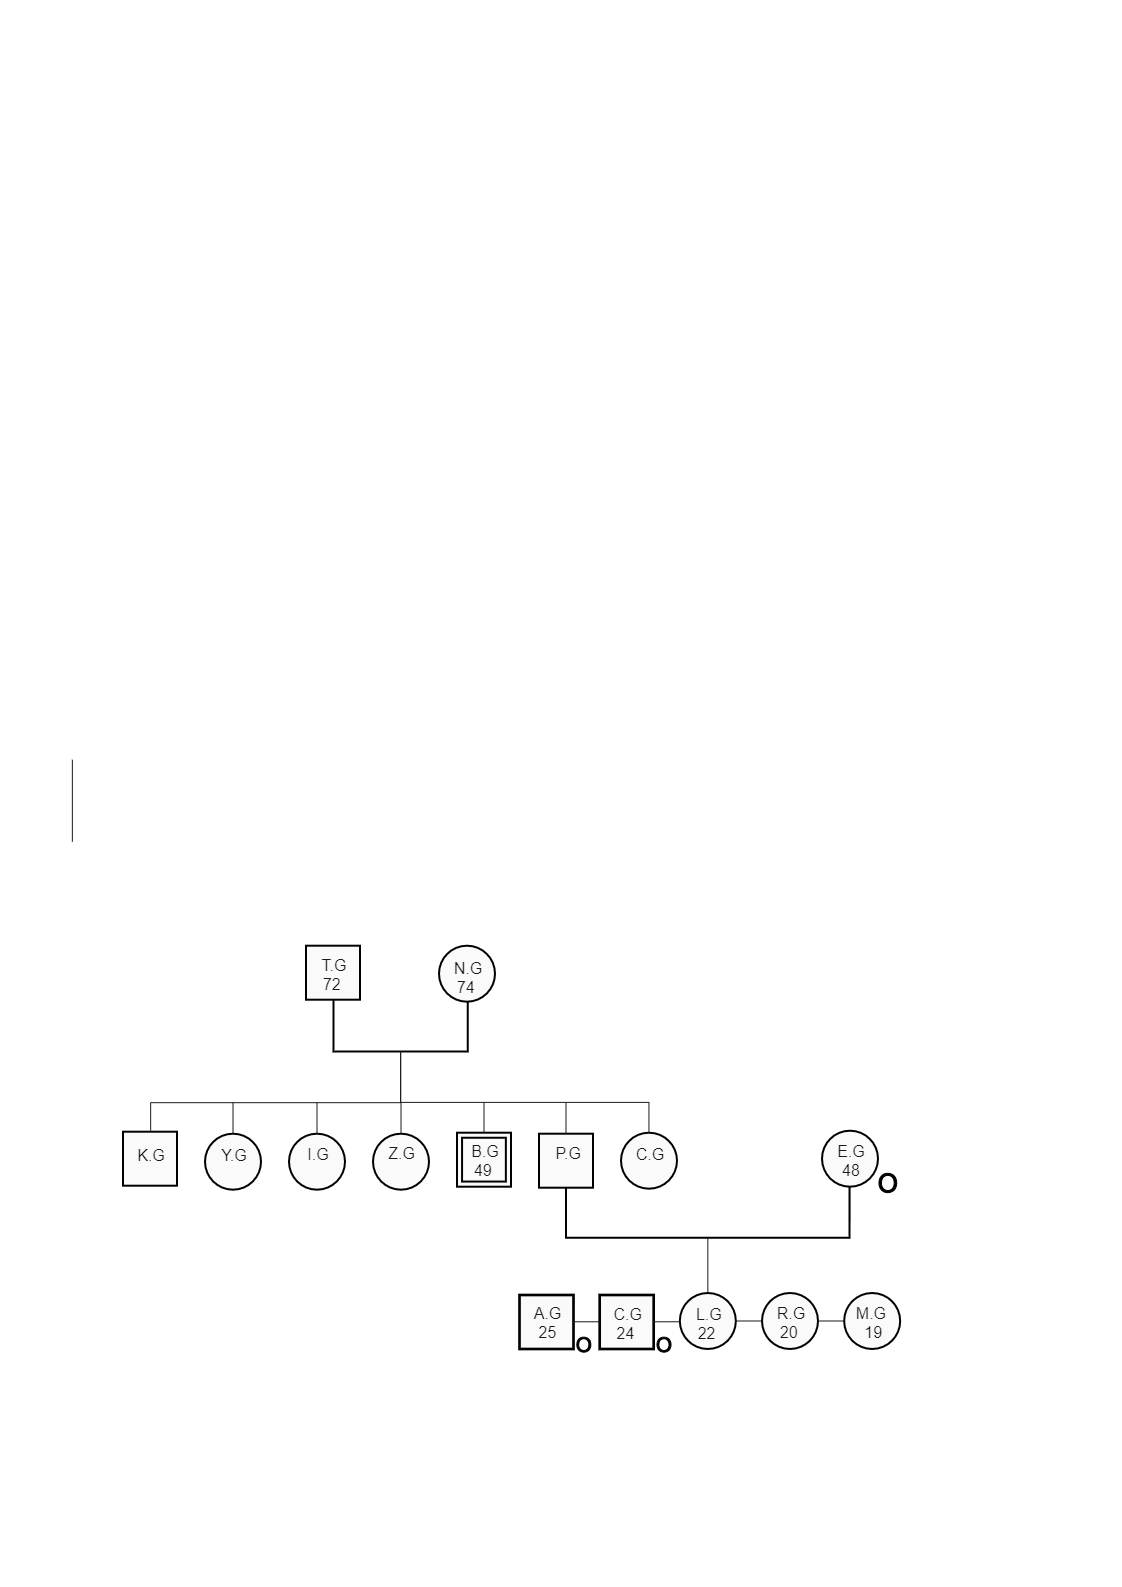
There is an ideal family relationship tree representation diagram, which can help understand an individual's family relationships by visualizing patterns and psychological factors affecting them. A genogram is created with simple symbols representing the gender, with various lines to illustrate family relationships.
The genogram may be defined as a visual tool for exploring a client’s social relationships across time. Typically, these are familial relationships. In general, the genogram is useful in gathering information, understanding relationship dynamics and behavioral patterns, promoting the client’s self-understanding, conducting assessments, and guiding the practitioner to interventions.


 Desktop