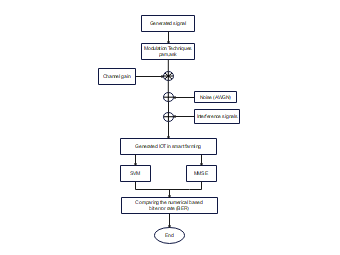
This flowchart represents the signal processing flow in IoT-based smart farming, starting from the generation of signals to the comparison of numerical bit error rates (BER). It includes steps like modulation techniques, channel gain, and the influence of noise and interference signals. Techniques such as Support Vector Machine (SVM) and Minimum Mean Square Error (MMSE) are used for optimization. This diagram is ideal for understanding the impact of signal interference on IoT systems in agriculture.