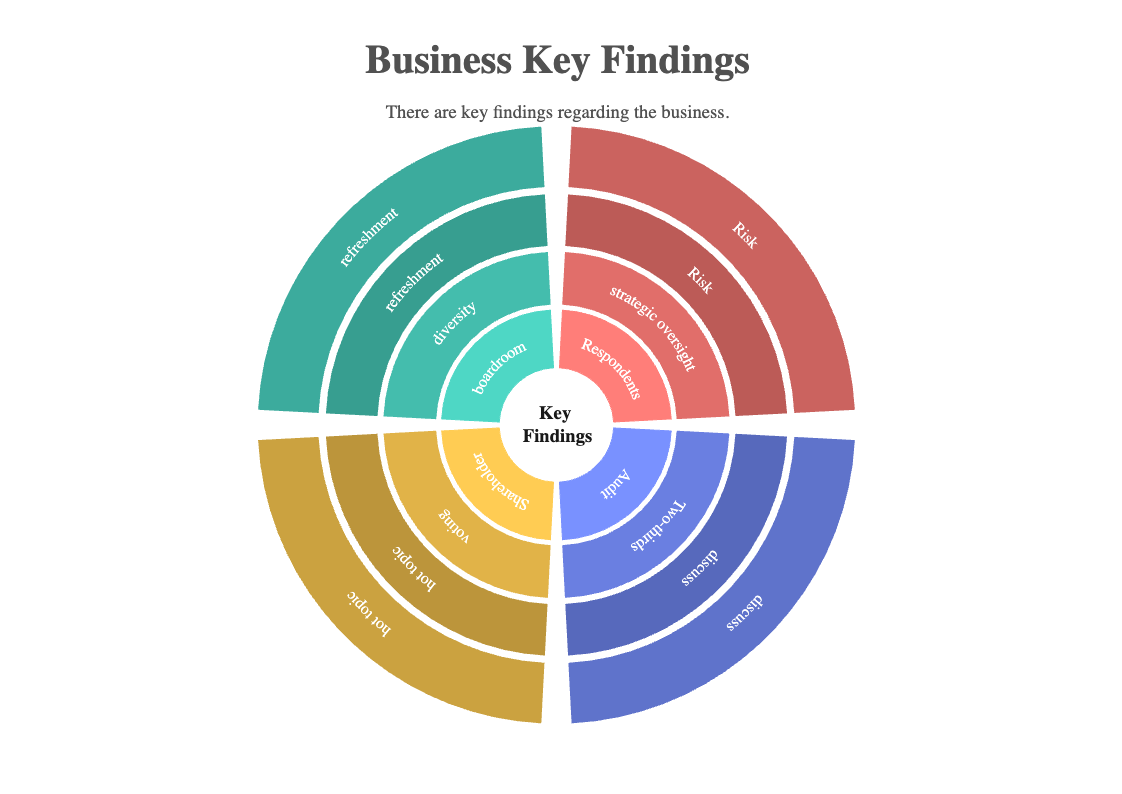
The Circular Diagram for Business Key Findings visually represents the significant takeaways from the business analysis. The diagram typically consists of several concentric circles that categorize the key findings into different levels of importance. The inner circle usually represents the most critical insights, while the outer circles contain less vital information. The diagram aims to provide a clear and concise overview of the most important findings from the analysis, making it easy for stakeholders to understand the results quickly. By presenting the findings in a circular diagram, the audience can quickly grasp the relationships between different categories and identify the most critical insights at a glance. A diagram is an effective tool for communicating the results of business analysis to a wide range of stakeholders, including executives, managers, and team members. EdrawMax is the best diagramming tool to create similar diagrams. Download EdrawMax today and start customizing similar templates.