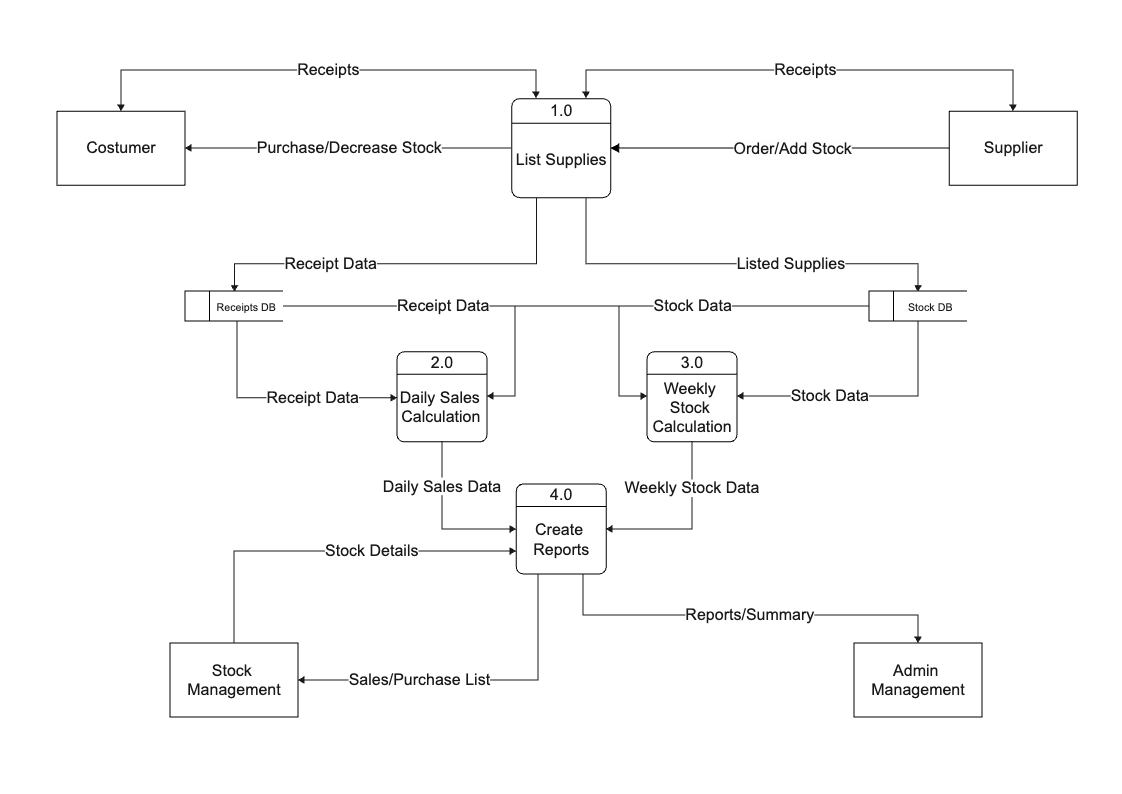
The Data Flow Model Diagram for Inventory Management System is a visual representation of the data flow within a computerized inventory management system. The diagram illustrates how data is input, processed, and output within the system. The inputs to the system include data about inventory levels, sales orders, and purchase orders. This data is processed within the system through various modules, such as inventory management, order management, and reporting. The processed data is then output in the form of inventory reports, purchase orders, and sales orders. The diagram provides a clear understanding of how data flows within the inventory management system, making it easier for users to identify potential bottlenecks and areas for improvement. This can help organizations streamline their inventory management processes, reduce costs, and improve customer service. Create a similar diagram using EdrawMax. Once you have customized the EdrawMax template, you can share it in different formats per your requirements.