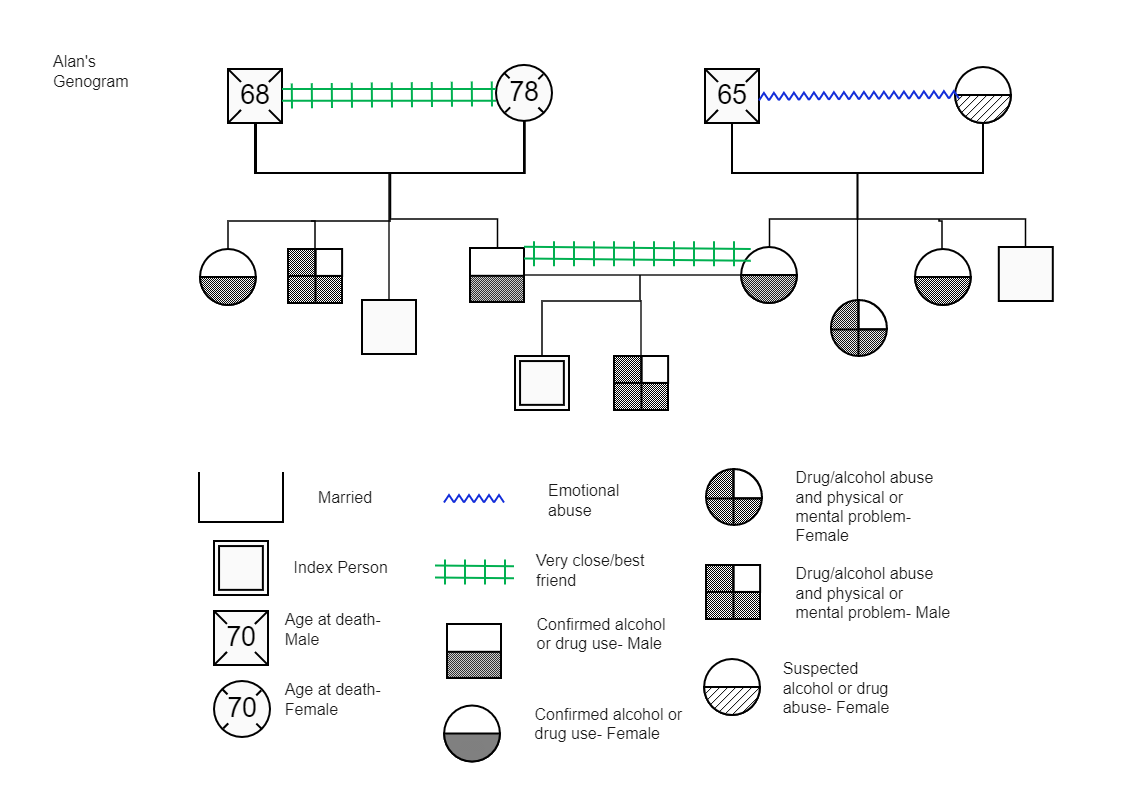
A genogram, also known as a Lapidus Schematic or McGoldrick-Gerson analysis, is a graphic depiction of a person's relationships, physical concerns, and psychological disorders. It also contains information on numerous generations of a given family. Typically, genograms begin with basic information such as the gender, name, and birth or death dates of each member in the family for the first two to three generations. A female is represented by a circle, whereas a man is represented by a square. Genograms are used to assist individuals in identifying behavioral patterns or inherited problems in a variety of professional sectors, including psychology and medicine.


 Desktop