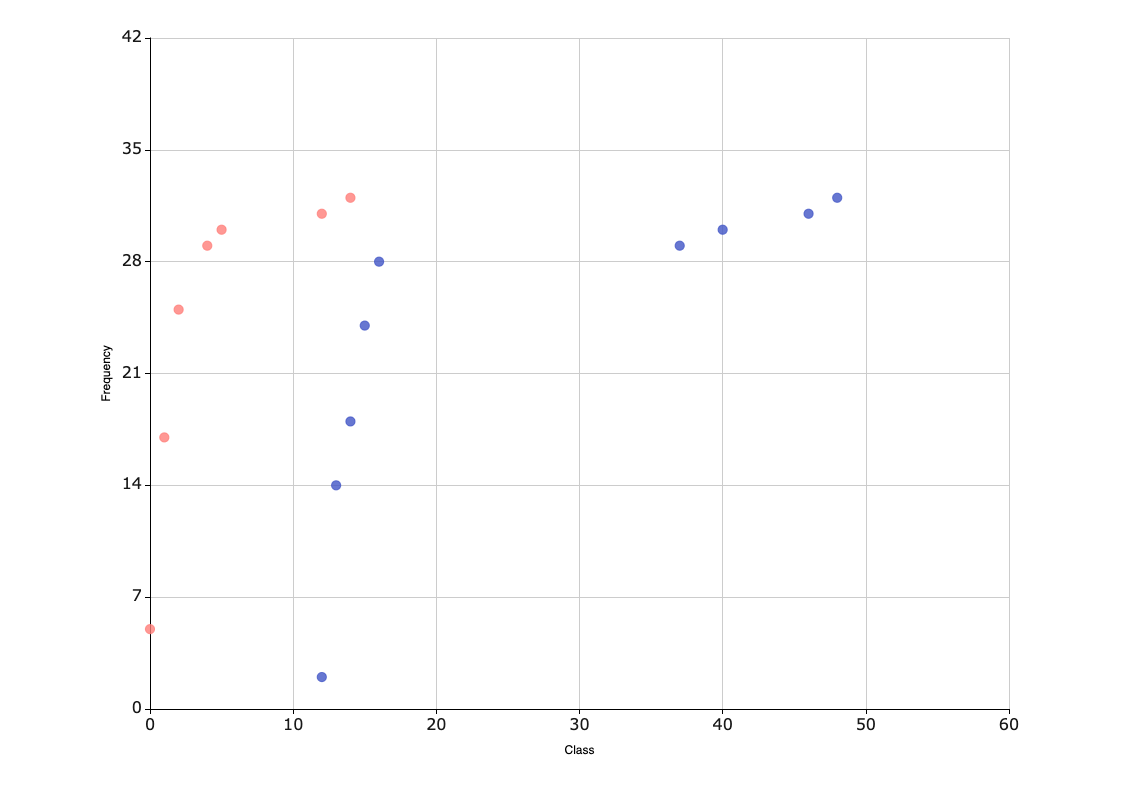
A scatter diagram is an effective way of showing the correlation between adult and youth literacy rates. The diagram will plot two variables on a graph, with one variable being placed on the x-axis and the other variable being placed on the y-axis. Depending on whether one variable has a higher rate or the other, it will be represented through either a positive or negative correlation. This visual representation can help identify trends in youth and adult literacy levels over time which could otherwise not be determined without this diagram. With EdrawMax, you can download this template and customize it 100%, like importing images from your computer or even sharing the file into VSDX format.