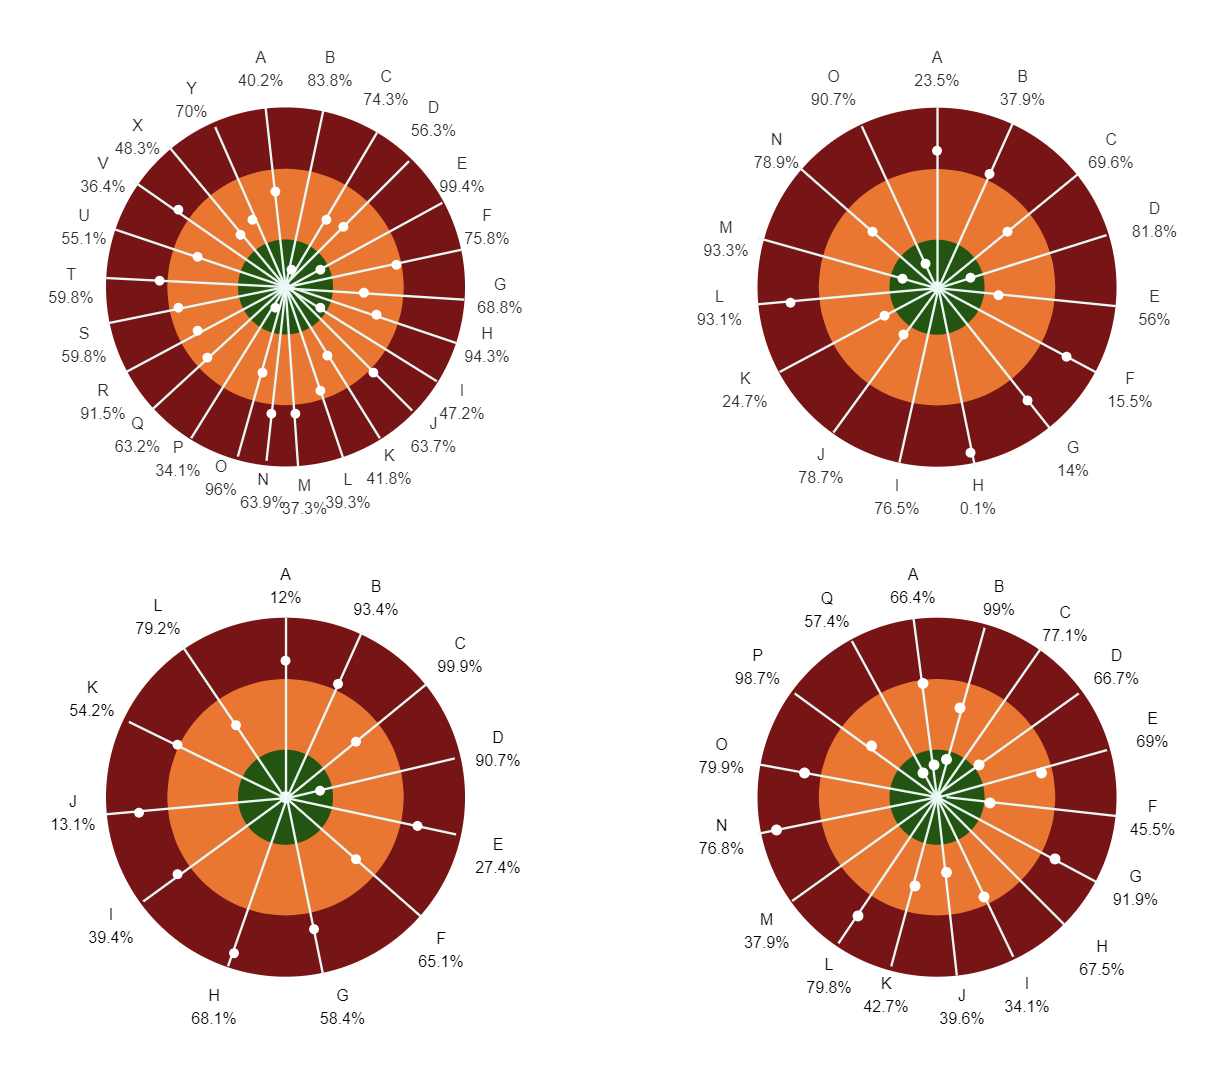
This Coding Target Chart In R is a more complex version of the basic bar chart. They are most commonly used to replace "flashier" gauges because they are more compact/efficient in displaying multiple measures simultaneously. It's a difficult problem to solve with a general function because bullet charts frequently do not adhere nicely to a single data frame and tidydata principles, often necessitate refactoring of the input data or external reference data, or at the very least require multiple columns to be charted. The bullet chart can be divided into two parts: the close range and the quantitative measure. To get started, use this Coding Target Chart In R template by EdrawMax.