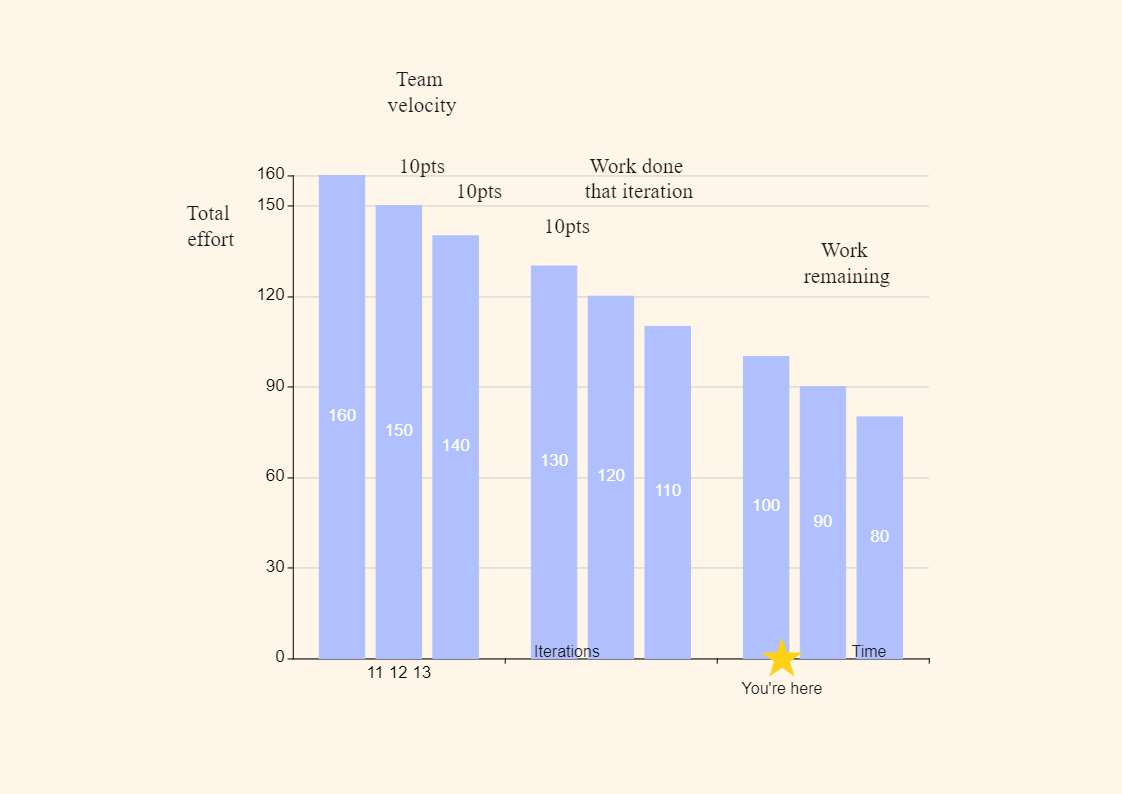
A burn down chart is a graphical representation of the amount of work remaining versus the amount of time available. Its frequently used in agile software development methodologies like Scrum. Burn down charts, on the other hand, can be applied to any project with measurable progress over time. In a burn down chart, the outstanding work is typically on the vertical axis, with time running horizontally. It can be used to forecast when all of the work will be completed. The Development Team updates the Sprint Burn Down and plans the remaining work for the day during the Daily Scrum.