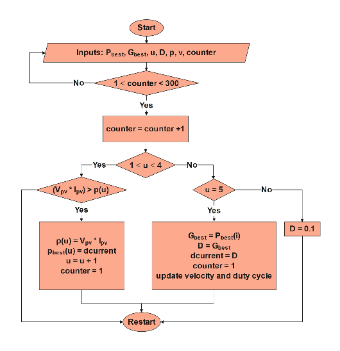
The template illustrates an optimization algorithm process flowchart, detailing the steps of executing an algorithm. The process starts with inputs including the best individual solution (P_best), the best global solution (G_best), decision variable (u), direction (D), speed (v), frequency (p), and a counter. The algorithm iterates to find the optimal solution by considering the range of the counter and the value of the decision variable u, continuously updating the velocity and duty cycle until the optimum is found or the maximum number of iterations is reached.
Such flowcharts are crucial for engineers and researchers in solving optimization problems, enhancing computational efficiency, and improving the quality of results.