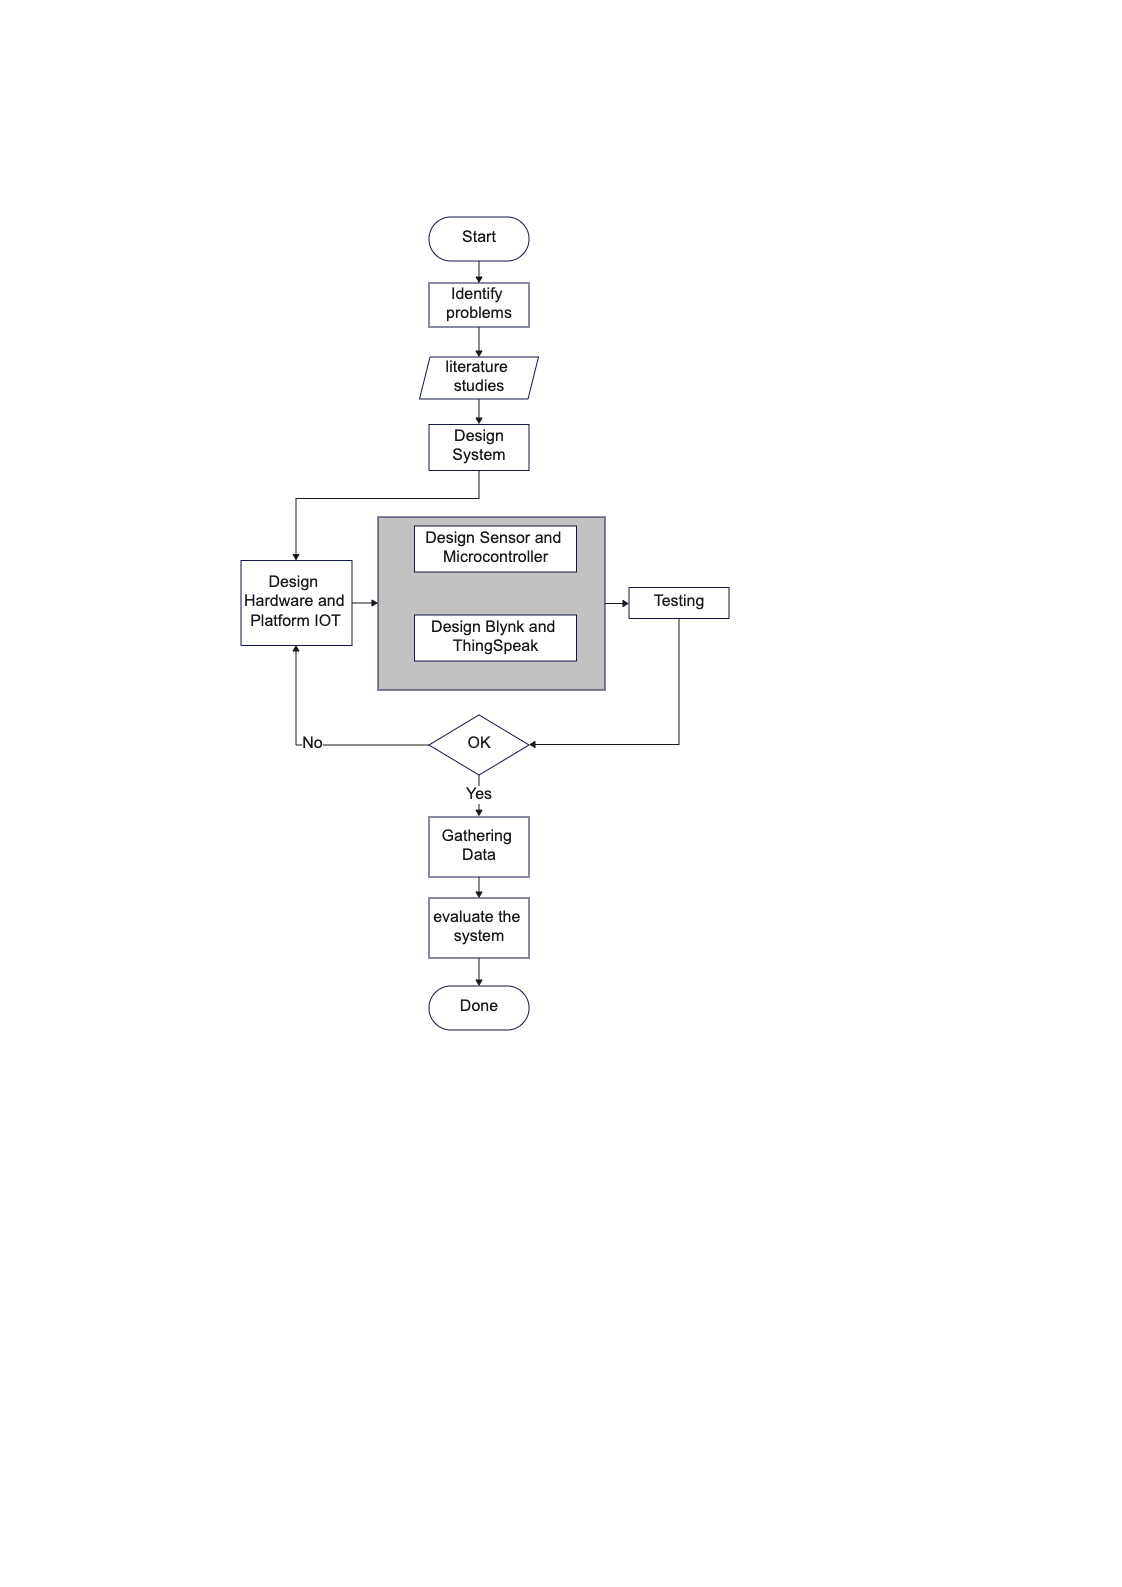
A flowchart can be used to demonstrate the IOT in-car air quality monitoring system. It provides a graphical representation of the various processes involved in order to help better visualize the sequence of events and decision points. This system includes sensors, air quality monitors, traffic data aggregation, feedback and analytics data, and other components that work together to monitor and alert drivers about air quality levels within their vehicles. Use EdrawMax to create a similar quality monitoring system's flowcharts.


 Desktop