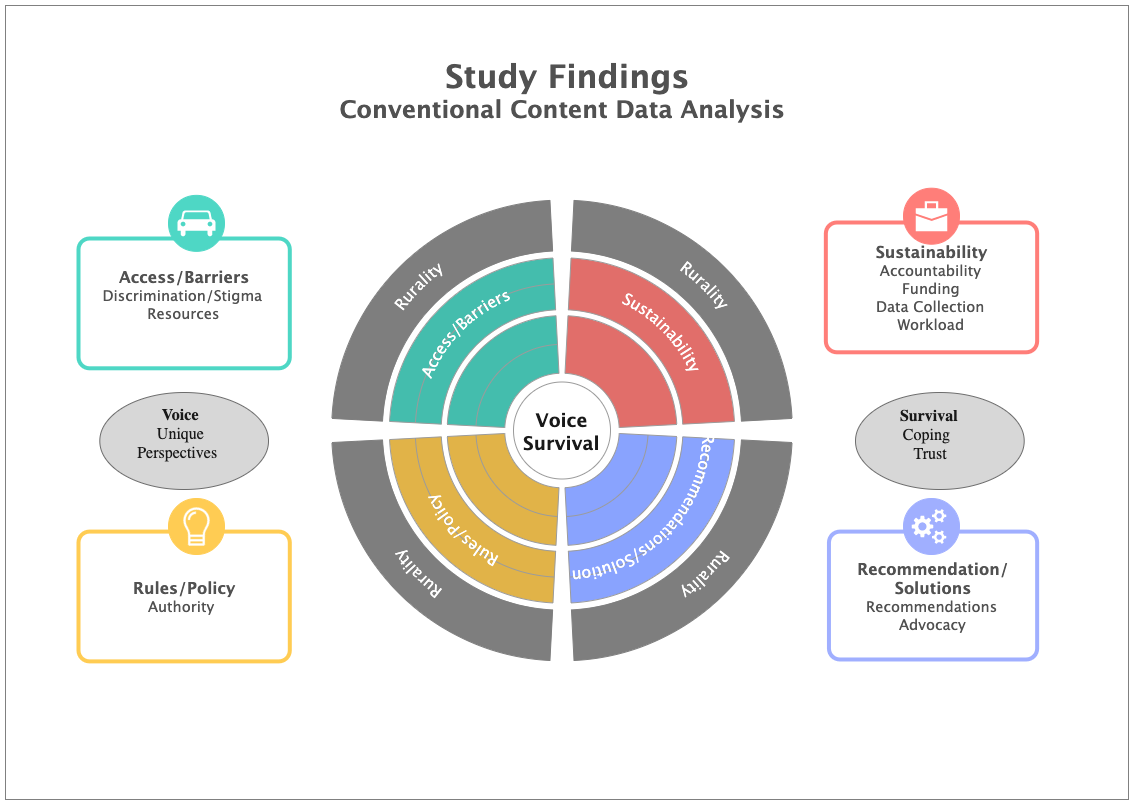
Data Analysis Diagrams are used to gain a unique perspective on conventional content data. Examples of these diagrams can include access and barriers, sustainability, accountability, and funding of rurality. These diagrams can allow for an in-depth exploration and analysis of data points in order to identify any underlying patterns or stories within the data. As you can see in this template, data analysis diagrams are the conventional way to analyze and present data in a visual representation. They can be used to represent relationships between multiple pieces of data or to display patterns in large amounts of data. Data analysis diagrams can be used to accurately assess trends or correlations and help identify potential problems or areas for improvement. In this way, they provide an invaluable tool for making objective decisions about a given situation. Create a similar design using the free templates and symbols provided by EdrawMax.


 Desktop