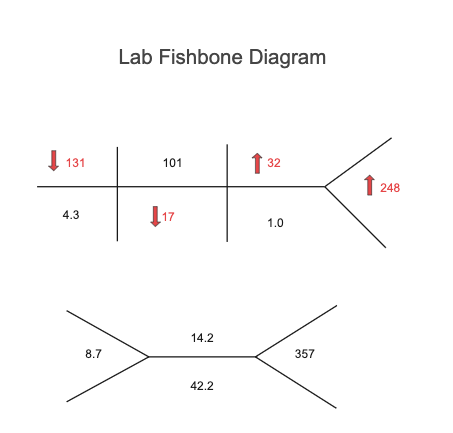
This is a fishbone (Ishikawa) diagram for clinical laboratory test results, intended to display the numeric values of various test outcomes and their trends of change. The numbers represent specific test measurements, while red arrows indicate an increase or decrease relative to standard reference values. Such diagrams enable medical professionals to quickly identify abnormal changes in test results, providing an initial assessment of a patient's health condition. Fishbone diagrams are widely used in medical health data analysis due to their clear structure, which facilitates recognition of result trends across different tests.