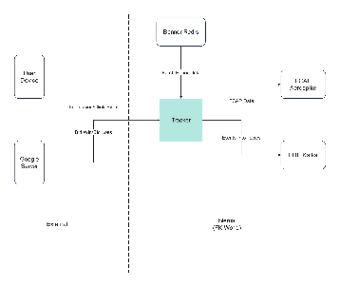
This Ad Tracking and Data Flow Diagram visualizes the interaction between various components in an advertising system. The diagram captures the flow of events such as impressions, clicks, bid wins, and bid losses from user devices and Google servers to the tracker. The tracker fetches banner information from Banner Redis, processes data into topics, and sends it to FCAP Aerospike and FDP Kafka systems for further data processing and analysis. The layout distinguishes between external and internal data flow, where external events trigger data collection, and internal systems handle data processing and management. This diagram is essential for understanding the architecture of an advertising platform, helping engineers and developers map out how events are tracked, processed, and stored.