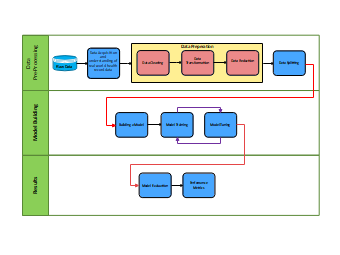
Here is a swim lane flowchart about IT network. It illustrates how the raw data process to building a model by using various sorts of boxes, with arrows connecting the boxes to show their succession. This is a useful tool for both people to visualize the logic of the process.