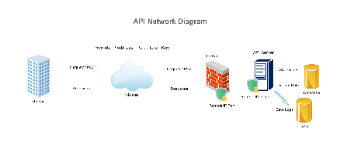
Created with EdrawMax, this “API Network Diagram” outlines the operational flow of an API system. A “Vendor” initiates a “Request/POST” through the “Internet,” supplying remote IP address, port, and token key. The request traverses a “Firewall,” which validates remote IP and port details, before reaching the “API Server.” The server executes an “SQL Query” on the “Database,” retrieves data, and returns responses. Additionally, the system saves operational logs in the “Logs” database. The diagram clearly maps how API networks manage data transmission, security filtering via firewalls, and backend data processing, serving as a practical reference for understanding API - driven network architectures, from user requests to server - side data handling and logging.


 Desktop