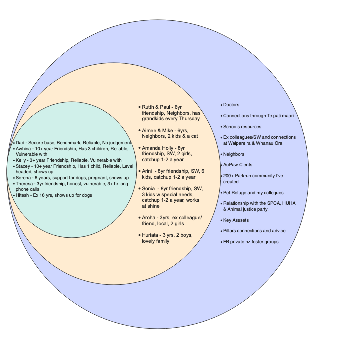
A Venn Diagram is a visual tool used to represent the relationships between two or more sets of data. It consists of overlapping circles, with each circle representing a different set. This template shows the relationships of different people by three sizes of circles, with the bigger one containing the smaller one. Click the template to know more or try to use EdrawMax to create yours.