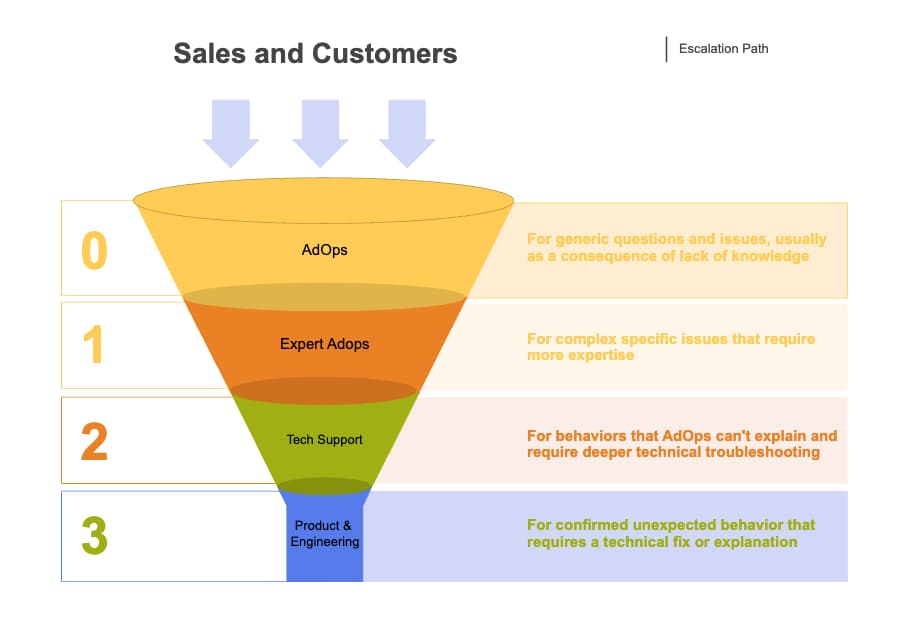
Funnel chart, also known as funnel graph, is a type of diagram used to visualize and analyze data in a way that resembles a funnel shape. Here is an example. As the template shows, it presents individual stages, each represented by rectangles placed in sequential order. The top rectangle is AdOps and the bottom is product and engineering. Click to learn more details about it.