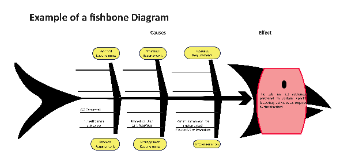
A Fishbone Diagram, also known as an Ishikawa Diagram or a Cause-and-Effect Diagram, is a visual tool used in quality management and problem-solving. Here is a sample for the root cause analysis of the issue that the Lab has not authorized personnel to perform specific laboratory activities as required by the standard. As the template shows, each cause is listed on a separate branch, and sub-causes can be further branched out from the main causes. This helps to identify and prioritize the root causes of the problem, making it easier to develop solutions. Fishbone Diagrams are widely used in industry, healthcare, and other fields to improve processes, reduce errors, and increase efficiency.