shadow
Templates Community / Drug Development and Sales Gantt Chart

Drug Development and Sales Gantt Chart

EdrawMax user profile image
Huong Quynh
Published on 2024-07-19
Edit online
Generate Diagram with AI
Download
logoanimation
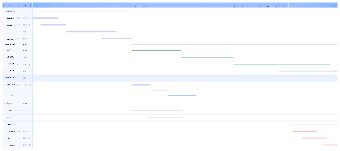
This is a Drug Development and Sales Gantt Chart, providing a visual timeline for the complex processes involved in bringing a pharmaceutical product to market. The chart outlines essential phases such as research and discovery, preclinical trials, clinical trials, regulatory approval, and market launch.
Tag
Marketing
Medicine
sale
Report
0
23
EdrawMax user profile image
Post
Recommended Templates