What is A Venn Diagram with Examples
Create a Venn Diagram Online Free Free Download Free Download Free Download Free Download1. What is a Venn Diagram?
A Venn diagram is a visual representation of similarities and differences between two or more concepts. It depicts relationships between two or more sets of data by using circles as an illustration. Each circle represents one particular set of data. Overlapping circles represent the similarities, while detached circles represent the difference between sets or concepts.
With the help of a Venn diagram, you can easily describe any relationship between two or more concepts. Using circles for the representation of data makes it simple to depict similarities between two or more factions. That is why these diagrams are typically used for business presentations, logic studies, and mathematics.
Normally, you can use any number of circles in a Venn diagram, but the most commonly used type is the triple-circle diagram. When three circles partially overlap each other in a diagram, they create a triangle at the intersection area. This triangle represents similar data in those three circles. It not only makes the visual presentation better; the layout also makes it easy to understand the logic behind it. Find more Venn diagram examples.
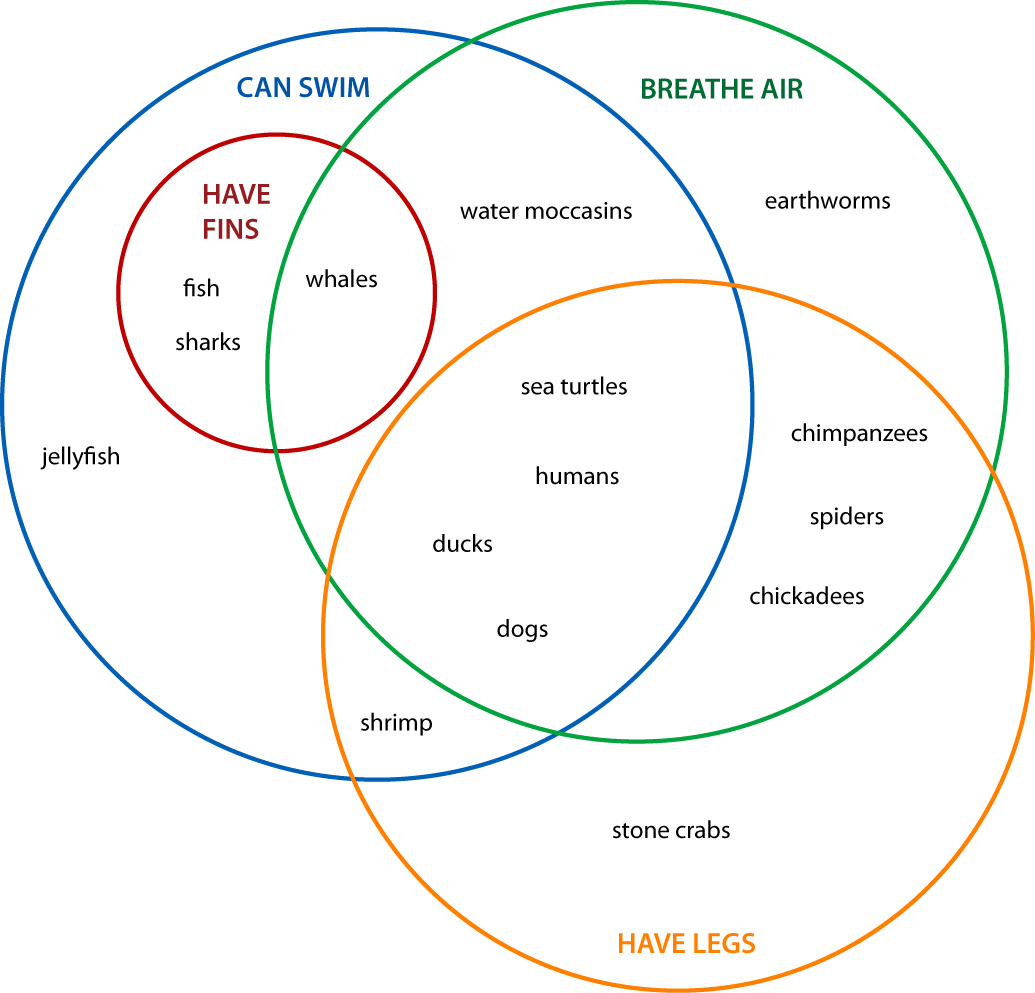
Image Source: pinterest.com
2. Venn Diagram Symbols
If we talk about the set theory, then you have to learn more than 30 symbols, but you can make a Venn diagram by only understanding the few basic symbols. The diagram represents the classification and comparison of data sets; therefore, you only have to learn six symbols to get started. There is an article to introduce Venn diagram symbols.
| Symbol | Name | Example | Description |
| A | Set A |  |
The letter A represents the circle with all the elements of set A in the diagram. |
| ꓵ | Intersection |  |
A ꓵ B= {9, 10} The symbol ꓵ between two sets represents only similar elements. It shows the elements that are only in both sets. |
| ∪ | Union |  |
A ∪ B= {1, 2, 3, 4,….., 10} The symbols ∪ between the two sets represent all the elements in both sets. |
| − | Difference |  |
A – B= {1, 2, 3, 4} By set A from set B, you get a solution set with elements of set A that are not in set B. |
| Ac | Complement of a set |  |
Ac= U-A You can find the complement of set A by subtracting all elements of set A from the universal set. |
| {} | Empty Set |  |
A={} This symbol depicts that the set does not have any elements. |
| U | Universal Set |  |
This symbol represents the set that contains everything. A universal set is a superset to every set included in the diagram. |
3. Venn Diagram Examples
The first Venn diagram example is in Mathematics. They are accessible when covering Sets Theory and Probability topics.
In the diagram below, there are two sets, A = {1, 5, 6, 7, 8, 9, 10, 12} and B = {2, 3, 4, 6, 7, 9, 11, 12, 13}. The section where the two sets overlap has the numbers contained in both Set A and B, referred to as the intersection of A and B. The two sets put together, gives their union which comprises of all the objects in A, B which are {1 2 3 4 5 6 7 8 9 10 11 12 13}.
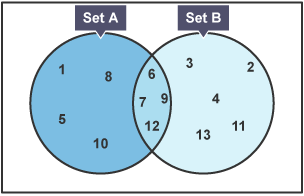
Image Source: bbc.co.uk
In the Venn diagram example below, it analyzes the commonalities and differences of different areas of work. Human Resource Managers and Career Experts use it to advise individuals in their career paths.

Image Source: pinterest.com
Scientist uses Venn diagrams to study human health and medicines. In the illustration below, you can see amino acids that are vital to human life.
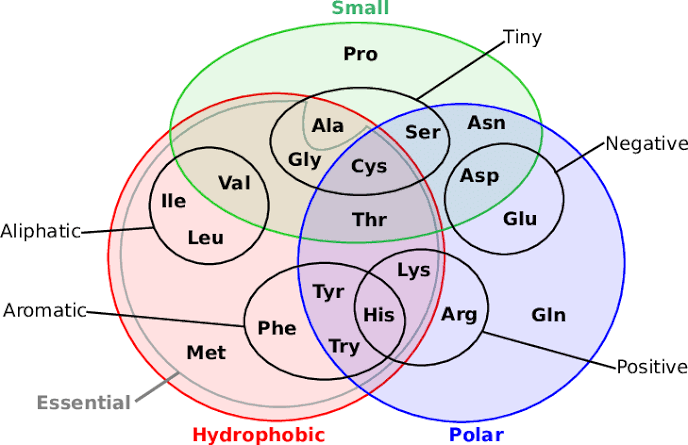
Image Source: researchgate.com
4. Why are Venn diagrams Important?
Better classification and comparison of data through visual representation while keeping everything simple. Venn diagrams make it easier to find the similarities and differences between opposing data sets. You can group similar data into chunks; it helps you easily identify intersecting information even if your diagram is complex. It means that you can create complex diagrams without affecting data classification.
Solving complex math equations is the reason why most mathematicians prefer using Venn diagrams to understand various concepts. It provides a better classification of real numbers in mathematics. You draw a universal set while solving math equations. Inside the universal set, you use circles or other shapes to represent sets of data. Just observing it helps you reach the solution.
Creative studying tool for students by representing simple concepts starting from grade school. Students come to understand Venn diagrams from comparing two sets and looking for similarities in math. It helps them get a solid grip on their concepts starting from grade school level.
Simplifying the logic between two or more statements helps a lot when it comes to Boolean operations and studying gates. Venn diagrams make it easy to understand the logic behind any process by highlighting similarities.
The utilization of business concepts with the help of the Venn diagram makes it easy to get a niche in the market for any business. Diagrams help you find probabilities by comparing data sets. You can also compare various choices to pick the one with more benefits and fewer risks for your business.
5. When to Use Venn diagrams?
You can use Venn diagrams to demonstrate relationships is statistics, logic, probability, linguistics, computer science, business set up, and many more areas.
In Mathematics, Venn diagrams are a teaching tool that explains Math concepts like sets, unions, and intersections. They also solve severe problems in advanced mathematics. You can read extensively about them in academic journals in your library and be amazed at how Set theory is a complete mathematics branch.
Statisticians employ the idea of Venn diagrams to foretell the chances of particular occurrences. It is also the case in the predictive analytics field. Sampled data sets are compared and scrutinized to point their similarities and differences.
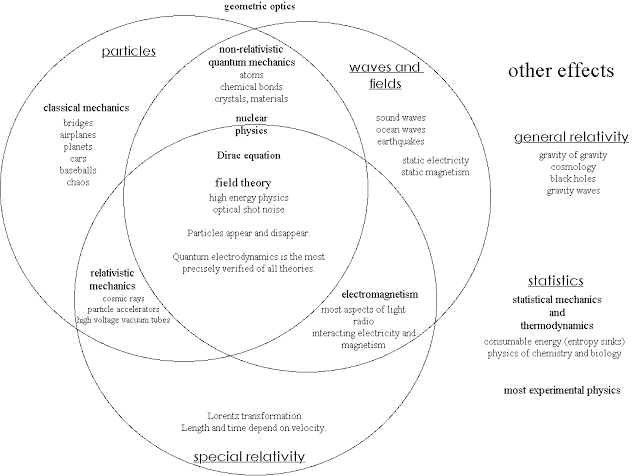
Image Source: pinterest.com
They are also efficient in determining logical grounds in arguments and conclusions. Like in deductive reasoning in case the premises are real, and the argument form happens to be correct, the outcome thereof must be right. A similar diagram to the Venn one on logic is the Truth Table. It puts variables into columns to decipher what is logically possible. Another one is the Randolph diagram, aka R-Diagram, it uses lines to explain sets.
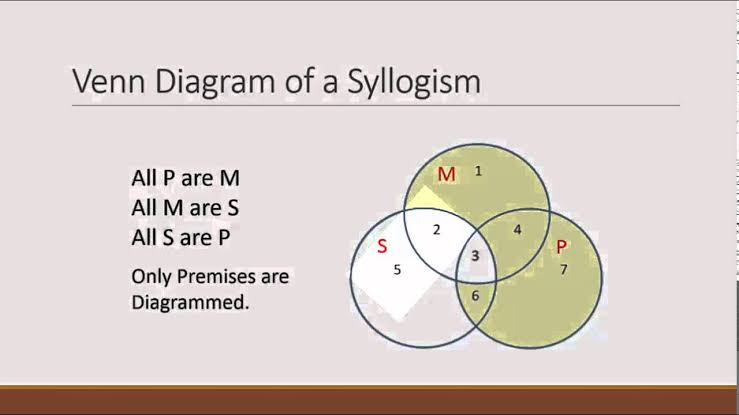
Image Source: youtube.com
In linguistics, Venn diagrams help to learn about how languages differ or relate, in terms of the alphabet, vowels, pronunciation, etc.
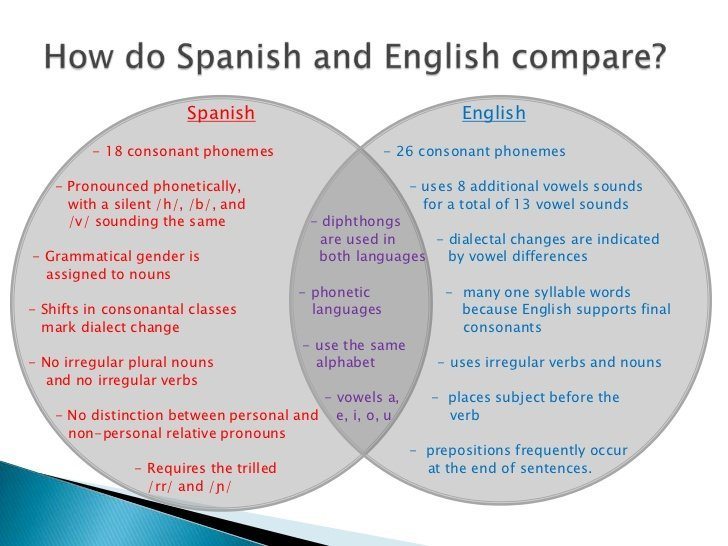
Image Source: slideshare.net
In computer science, geeks and programmers use Venn diagrams to get a clear picture of languages and hierarchies in computer systems.
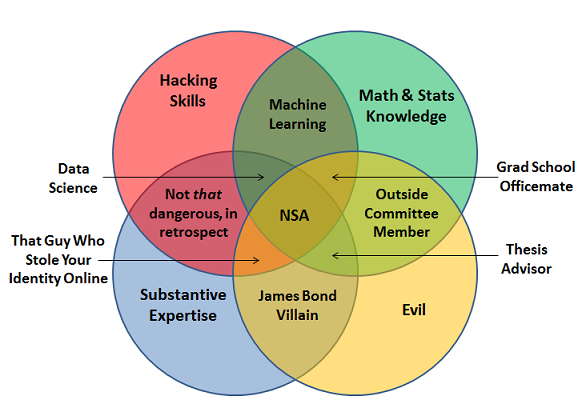
Image Source: kdnuggets.com
The diagrams are also useful in the sales and marketing field for comparing and contrasting products, services, processes, and all that goes on in business set-ups. They are practical and efficient in improving sales and profits and the broad running of enterprises.
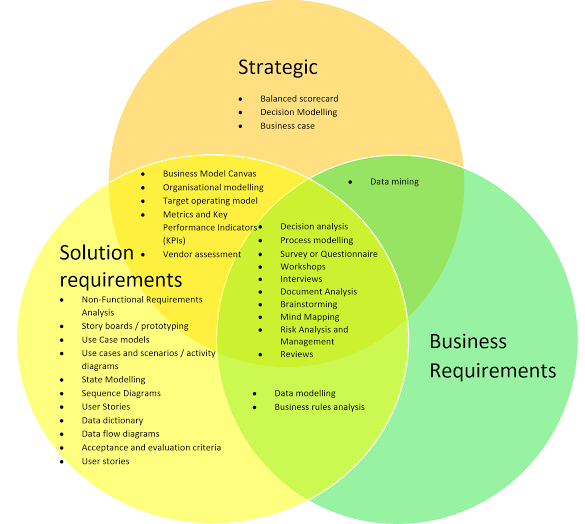
Image Source: businessbullet.co.uk
6. Evolution of Venn Diagram
The growth of the Venn diagram dates back to 1880 when John Venn brought them to life in an article titled ‘On the Diagrammatic and Mechanical Representation of Propositions and Reasoning.’ It was in the Philosophical Magazine and Journal of Science. John Venn carried out a thorough research on these diagrams and foresaw their formalization. He is the one who originally generalized them, no wonder their naming, i.e., Venn Diagrams in 1918.
There is a small gap between Venn diagrams and Euler diagrams invented in the 18th century by Leonhard Euler, who also had a hand in its development in the 1700s. John used to refer to the charts as Eulerian circles.
The development of Venn diagrams continued in the 20thcentury. For instance, around 1963, D.W Henderson revealed the existence of an n-Venn graph consisting of n-fold rational symmetry, which pointed out that n was a prime number. This concept was delved into by four other intellects in the following years, who concluded that rotationally symmetric Venn diagrams only exist if n is a prime number.
Ever since, these diagrams have become part of today’s studying curriculum and illustrate business information. Venn and Euler’s diagrams got incorporated as a component of instruction in the set theory of the new math movement in the year 1960.
7. How to create a Basic Venn Diagram in Minutes?
Now, we will use EdrawMax’s online software. It has all the basic symbols and shapes you need alongside numerous Venn diagram free templates and a fancy and advanced interface that is easy on beginners.
Before starting the Venn diagram online, you have to ensure you:
- Determine the goal you want to achieve. Have a clear understanding of what you would like to compare and for what purpose is the comparison needed. It facilitates the definition of sets.
- Run through and come up with a list of items contained in the sets.
- Peruse through the available templates to have a hint of what you are about to draw and then make your own Venn diagram using the following steps.
Step 1: Log onto the software’s website from EdrawMax Online. If you had not created an account prior, sign in using valid credentials, verify your account then log in.
Step 2: Select Business Diagram options from the Available Templates tab and double click on the Venn Diagram icon to display an empty page onto which you will draw.
Step 3: On the left pane of the screen, you will find all the required Venn diagram symbols and shapes. Drag and drop appropriate ones and drop them onto the drawing canvas to make your Venn diagram.
Step 4: Save the done Venn diagram in the available formats or export or share it to other platforms directly from the Edraw webpage.
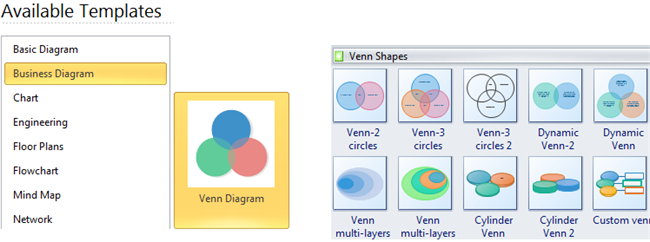
Step 5: Customization. Most in-built shapes are designed to allow for resizing, editing, and make color changes.
-
To resize a circle, drag the yellow icon on the edge of the circle and release it when you are satisfied with the new circle size.

-
To change the size of the intersection segment or reposition the circles, locate the yellow dot in the middle of the circle and drag it carefully until you achieve the desired adjustment.

-
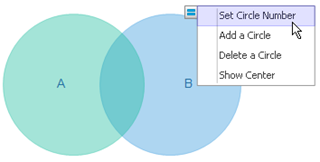
To input, various circles, tap on the Actions button and choose Set Circle Number.
-
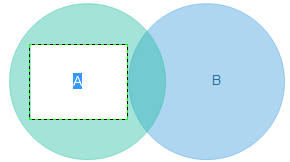
To input new text in a set, tap on the Textbox and type.
-
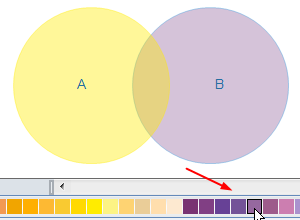
To make color changes, tap on the target circle, at a time more than once, and choose a color from the quick color tab at the bottom.
-
To incorporate a personal Theme and Style, choose from the available fonts, effects, and color schemes. Make a unique and professional Venn diagram by clicking on what you prefer.

8. Venn Diagram FAQ
Following are the answers to some of the most asked questions regarding Venn diagrams.
What is the Venn diagram used for?
You can use the Venn diagram for lots of things. You can use it to find a niche in the market for your business. It helps you a lot with presentations regarding classification and comparison of data. You can also use it to solve complex math equations. These diagrams are also a part of psychology programs.
What is a Venn diagram in math
Math is the origin of the Venn diagram. It comes from the set theory and helps you solve complex equations and set problems. Students use these diagrams to classify the relationships between elements of two or more sets. They can highlight similar and different elements between sets by using various set operations such as union or intersection.
How to read the Venn diagram?
Reading a Venn diagram is simple. All you have to do is look at the circles in the diagram. If the circles overlap with each other, then that means there are some similar elements on both sets. If the circles do not overlap, then that means there are no similar elements.


