How to Make a Venn Diagram in Google Docs
Sometimes, you may need to create word documents in Google Docs and want to insert a Venn diagram or chart into it. In this tutorial, we will show you how to make a Venn diagram in Google Docs, and then give you a quick and intuitive solution to help you work efficiently.
How to Make a Venn Diagram in Google Docs
In general, you can use Google Drawing and manually add circles to build your Venn diagram in Google Docs. Because there is no pre-made Venn diagram template in the Google Template gallery. However, you are only able to create some simple Venn diagrams with Google Drawing, otherwise, you will spend more time in beautifying your diagram.
Just follow these steps and then we will tell you an easier way of making Venn diagrams.
- Open a new Google Docs document on your browser.
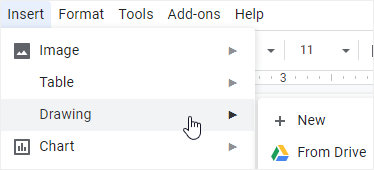
- Go to Insert tab, select Drawing > New to open Drawing
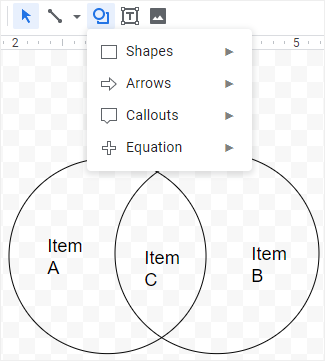
- Draw circles and add text boxes to complete the Venn diagram.
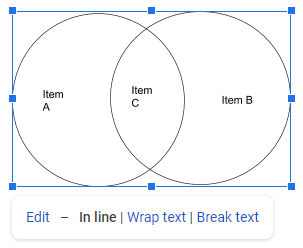
- Click Save and Close if you finish the diagram.
- Click Edit to return to the Drawing window and make changes in the diagram.
How to Make a Venn Diagram in EdrawMax
After you manually make a basic Venn diagram using Google Drawing, you may be interested in where to find a better application for making stunning and diversified Venn diagrams quickly. Here, you can give EdrawMax a try.
Step 1: Use an inbuilt Venn Template
To make a Venn diagram in just one-clicking, open (EdrawMax Online), select Basic Diagram > Venn Diagram, and you’ll see various types of Venn templates in the template gallery.

Scroll the page, pick one of these templates and click on its thumbnail. The selected template will be opened on a new webpage. Then you can add text or numbers on the text boxes directly.
These Venn templates are quite suitable for inserting into slides and they will make your presentation eye-catching and remarkable.

Step 2: Add Inbuilt Venn Shapes
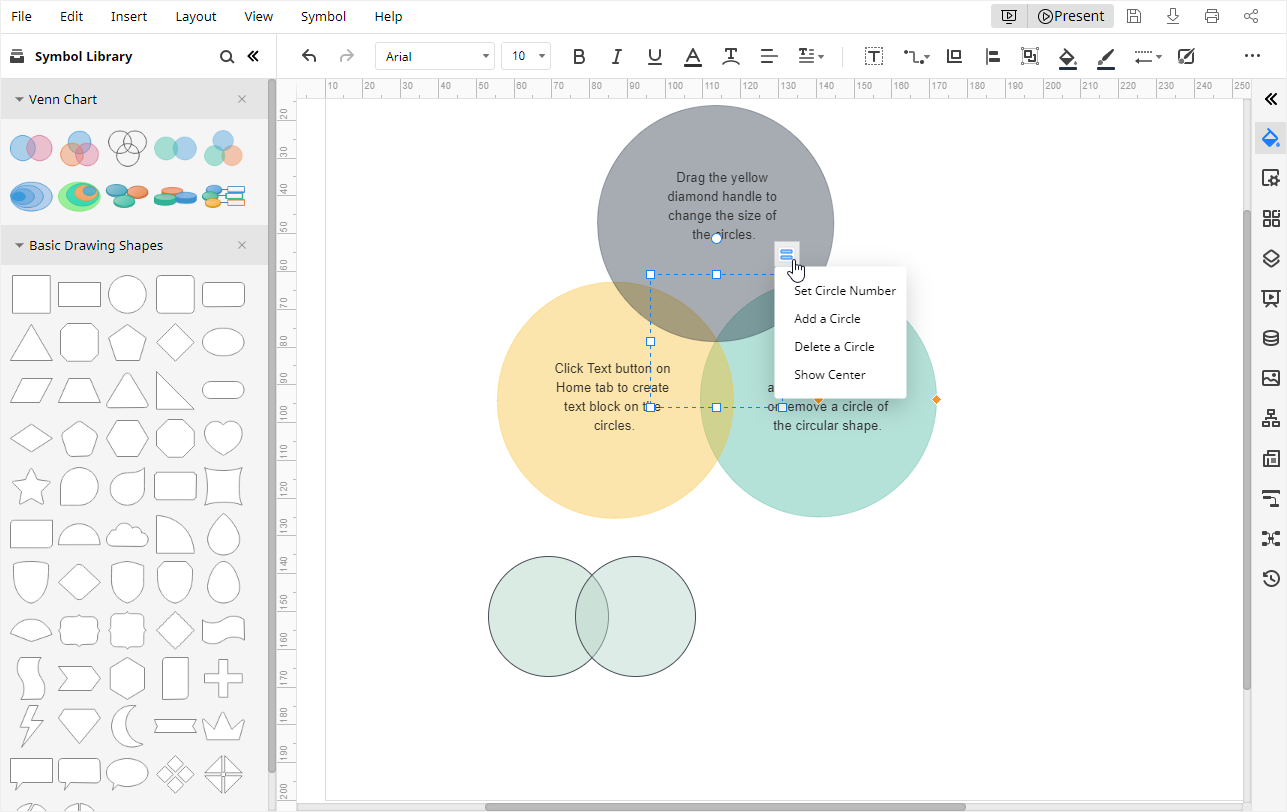
To build a Venn diagram from scratch, click on the Symbol Library icon ![]() to open Library dialog box, then tick Venn Chart under the Diagram category and click OK.
to open Library dialog box, then tick Venn Chart under the Diagram category and click OK.
Drag and drop Venn shapes from the left Library pane, click on the floating button in the shape center, you can select to add or delete circles on the floating menu directly.
Besides, you can also add Basic Drawing Shapes to the Library pane, and drag circles onto the page.
Step 3: Customize Your Venn Diagram
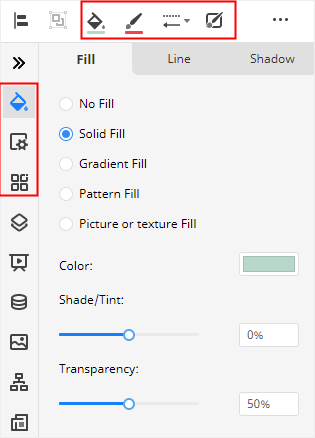
EdrawMax allows users to customize their diagrams or charts with different formatting tools. The most commonly-used tools are on the Fill/Line/Shadow pane, Page Setup pane, Theme pane, and the toolbars respectively.
If you add circles manually from the Library pane, you should select the circles, choose Solid Fill and increase the value of transparency. Otherwise, the intersection of the circles is invisible on the page.
Step 4: Present Your Venn Diagram
Click on the Play button on the upper right corner, the current Venn diagram will be presented on your computer in the full-screen mode and you will see how your Venn diagram looks like in a presentation.

How to Export an Edraw Diagram in Common Formats
When you finish creating your Venn diagram in EdrawMax, you will be surprised that EdrawMax allows users to save documents in clouds and export files in common formats.
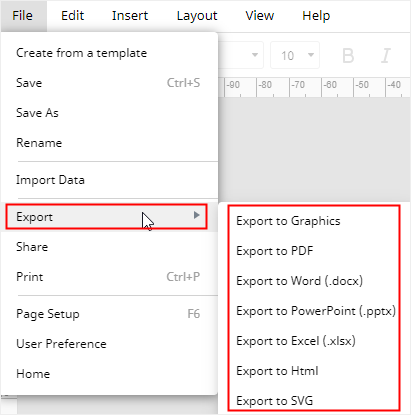
Go to the File tab, click Save As and then you can choose to save your diagram in Edraw personal cloud, Google Drive or Dropbox. Click on Export and you are able to export your Venn diagram in many common file formats, like JPEG, PNG, PDF, DOCX, PPTX, XLSX, etc.
Moreover, you can edit and modify your Venn diagrams in Word, PowerPoint and Excel when you export it from EdrawMax in MS Office file formats. Hence, you don’t need to worry that your friends, partners or students who are non-Edraw users will have no access to your Venn diagrams.
Sign up for EdrawMax or click the button below to get started.
