Free Editable Cause and Effect Graphic Organizer Examples
A cause-and-effect graphic organizer is an excellent note-taking tool for teaching, brainstorming, and planning. It is very useful to students and professionals; however, making a cause-and-effect graphic organizer is hard and takes time. In these situations, you can use cause and effect templates and examples to create a framework to identify the causes and effects of various things. We will talk about some graphic organizer examples and how to make these online.
1. What is Cause and Effect Graphic Organizer
A cause and effect graphic organizer is a fantastic tool that helps students clarify and organize complex information and ideas. With this technique, you can figure out the effects of any cause and causes of any effect. It visually represents the relationship between various ideas or events. Teachers use this tool to help their students understand cause and effect writing concepts and develop critical thinking. These graphic organizers are also helpful in creating presentations for marketing and describing the effects of various situations or actions.
How to use it?
- Write the title of the problem or topic you want to explore or organize.
- In the cause section, list what you think are the reasons for the problem.
- In the effect section, list the things that happened due to these causes.
2. The Cause and Effect Graphic Organizer Examples
You can use a cause and effect graphic organizer to organize information and explore the causes and effects of any event or problem. These graphic organizers can depict underlying causes and effects of a reading passage for a series of events. The type of diagram or layout you use to create these graphic organizers depends on what you want to explore. Picking a suitable design for your task makes your job much easier. Here are some cause and effect graphic organizer examples that will help you learn everything you want to know. Check out these examples and pick a suitable template for your assignment.
|
|
|
| Cause and Effect Graphic Organizer | Graphic Organizer Cause and Effect | Cause and Effect Graphic Organizer PDF |
|
|
|
| Cause and Effect Graphic Organizer Printable | Cause and Effect Graphic Organizer Examples | Cause and Effect Graphic Organizer 4th Grade |
|
|
|
| French and Indian War Cause and Effect Graphic Organizer | Cause and Effect Graphic Organizer Template | Cause and Effect Graphic for Kids |
Example 1: Cause and Effect Graphic Organizer
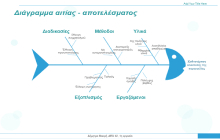
A cause and effect graphic organizer helps with smooth brainstorming sessions and problem-solving activities when the whole team agrees on one statement or topic and determines its causes and effects. You can use various diagrams to create a cause-effect organizer. The diagram in this example is a fishbone diagram mainly used to identify the multiple causes regarding a specific problem. The title of the problem goes on the center-right side. Each bone in the fishbone diagram represents the effects or causes of the described situation.

Click on the image to edit. Source: EdrawMax Online
Example 2: Graphic Organizer Cause and Effect
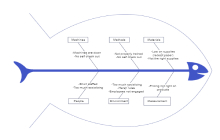
A business graphic organizer cause and effect visually represent various factors that could change multiple things in a business with both good and bad effects. With these graphic organizers, marketers can figure out which strategies will yield better results and what technique will make the process more efficient. The fishbone diagram in this example is a cause-effect graphic organizer to identify the effects of various causes in a business. The effects on the business area are in the boxes connected with fishbones, and the text in the connectors represents the causes.

Click on the image to edit. Source: EdrawMax Online
Example 3: Cause and Effect Graphic Organizer PDF
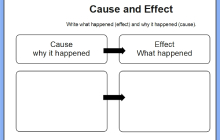
The cause and effect graphic organizer PDF identifies the relationships between two entities and depicts the causes and effects easily. There is no specific layout of a chase effect organizer, and you can use any diagram or chart you think is perfect for your task or assignment. The template in this example is a simple cause-effect chart with the causes on the left side and the effects on the right side. The problem statement or topic title goes at the top. Each situation or event depicted in the charts is wholly based on the central idea.

Click on the image to edit. Source: EdrawMax Online
Example 4: Cause and Effect Graphic Organizer Printable
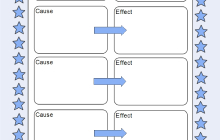
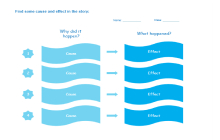
The cause and effect graphic organizer printable template is the most commonly used graphic organizer because it is easy to edit and print. Teachers use these organizers to give assignments and tests to their students. This example is a sequence chart depicting why it happened, refers to the cause, and what happened referred to as its effects on the situation. The boxes on the right side are the cause section, where you can write the details and reasons for the event. In the right area, you can report the effects it caused.

Click on the image to edit. Source: EdrawMax Online
Example 5: Cause and Effect Graphic Organizer Example
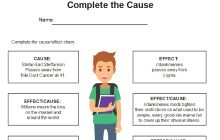
This is a cause and effect graphic organizer example for test assignments. Teachers use these tools to teach their students how to organize information logically and how to identify the cause and effect of any event or situation. There are a total of seven boxes in this template. The labels of the two boxes in the top row are cause and effect. Other than these boxes, the labels on the rest are effect/cause, making it harder for students to identify their category. The students determine their type and draw a chain to complete the sequence diagram.

Click on the image to edit. Source: EdrawMax Online
Example 6: Cause and Effect Graphic Organizer 4th Grade
A cause and effect graphic organizer for 4th-grade students is best to teach primary schoolers to determine the causes and effects of various situations or problems in a text paragraph. It helps them improve their reading skills and makes helpful notes and brainstorm to figure out what happened due to the causes and why these causes occurred. Students can use this cause-effect diagram to clarify and organize complex information, and they can determine the leading cause of the problem and solve it from the roots.

Click on the image to edit. Source: EdrawMax Online
Example 7: French and Indian War Cause and Effect Graphic Organizer
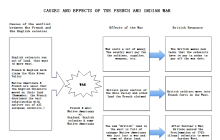
This French and Indian war cause and effect graphic organizer visually represents the reason behind the dispute between the French and English colonists and how it affected the people. The causes of the war are in the boxes on the left side. The war started because native Americans and French were upset due to English colonists moving to their land. The effects of the war and the British's response are in the boxes on the right side. Lots of money got wasted on the war, and some land got stolen from the native Americans.

Click on the image to edit. Source: EdrawMax Online
Example 8: Cause and Effect Graphic Organizer Template
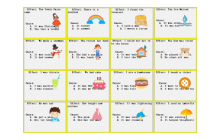
With a cause and effect graphic organizer template, teachers can make creative reading books for their students to teach them the basics of cause and effect of any event or situation. It also helps them understand the benefits of logically organizing information and developing out-of-the-box thinking. There is a picture book template in this example. You can see various pictures, each with an effect written at the top and two causes written at the bottom. The template is attractive, and kids will love to read it and, at the same time, learn more about the cause and effect method.

Click on the image to edit. Source: EdrawMax Online
Example 9: Cause and Effect Graphic for Kids
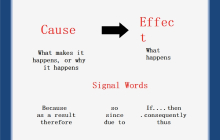
Educators use cause and effect graphics for kids to help them improve their reading and writing skills problem-solving skills. It teaches them how to clarify complex information and use it in brainstorming sessions. The diagram in this example is a standard cause-effect template for kids. You got the cause and effect at the top. The template showcases the usage of the signal words mentioned in it. Using these nine words, students can write a sentence that uses these signal words and improve their writing.

Click on the image to edit. Source: EdrawMax Online
3. Online Cause and Effect Graphic Organizer Maker
A cause and effect graphic organizer is an excellent tool for teaching and brainstorming. Teachers and professionals use these tools to represent why various situations occur and their effects. You can easily understand a cause-effect organize, but making one is difficult without an excellent diagramming tool. EdrawMax Online is the best online cause and effect graphic organizer maker. It gives you hundreds of professional templates that you can customize to create your graphic organizer in a few clicks. It also comes with a comprehensive symbols library and gives you the option to export your diagram in any format you want.
4. Key Takeaways
A cause and effect graphic organizer helps you identify the causes and effects of various problems and situations. Teachers use these organizers to explain the cause-effect method to their students and teach them brainstorming. EdrawMax helps you create cause and effect graphic organizers online and complete your assignments. It comes with a strong template community and thousands of diagramming symbols and icons. It also supports various document formats. Find more graphic organizer templates in the templates community.


