Coca Cola BCG Matrix Analysis

1. Introduction
The Boston Consulting Group (BCG) growth-share matrix is a business planning tool that helps a business prioritize its products by investment and ROI. For example, the BCG matrix of coca-cola plots its products in a four-quadrant matrix in which the y-axis shows the market growth rate and the x-axis depicts the market share. BCG matrix is also called the growth-share matrix.
2. Background of Coca Cola
Coca-Cola is a large-scale beverage company operating for more than a century. It all started on May 8, 1886, when Dr. John Pemberton sold the Coca-Cola drink at Jacobs' Pharmacy in downtown Atlanta. Coca Cola has grown from a small firm to a multinational company with a global presence from this humble beginning. The company has shown sustained growth based on its consistent quality and brands
3. Coca Cola BCG Matrix
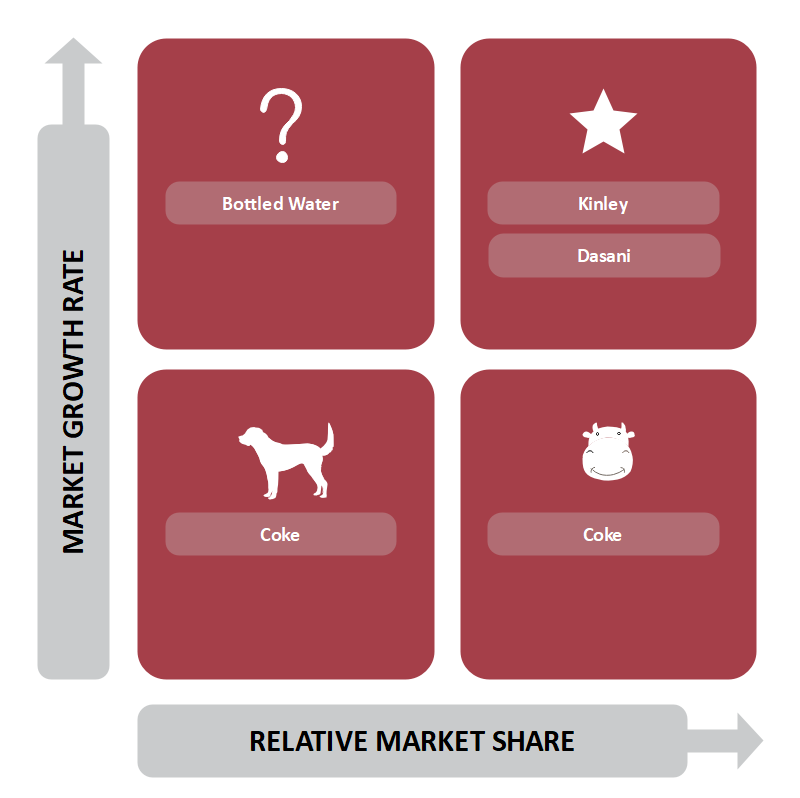
The BCG Matrix of Coca-Cola shows different products in four quadrants named the Dogs, Stars, Cash Cows, and the Question Mark. In the BCG Matrix of Coca-Cola, we will analyze its slow growth products, high selling products, high growth products, and high predictive selling and low growth products.
Source: EdrawMax Online
3.1. Dogs
A company's products with low growth and market share and no promising growth chances are called dogs. Management usually does not show any interest in these products and doesn't invest here because of low chances of profit or benefits.
In the BCG matrix of Coca-Cola, we can see that Coke is a potential dog product because of the declining demand for carbonated soft drinks in favor of increasing demand for healthier options or low-calorie drinks. If these factors keep increasing, Coke, a cash cow, can become a low market share product.
3.2. Stars
The products or business units with a high market share in a high-growth industry are the stars of the business. In the BCG matrix of Coca-Cola, the bottled water segment is categorized as star products. Coca-Cola offers two bottled water brands, namely Kinley and Dasani, operating in separate geographical locations. Kinley is offered in European markets, while Dasani is popular in the US. As the market for healthy drinks and bottled water is expanding, this segment of Coca-Cola is expected to gain a bigger market share and a better opportunity for further investment.
This is why Coca-Cola is investing in more brands like sparkling water and flavored water.
3.3. Cash Cows
Cash cows are products that have low growth markets but high market share. They have a high market share in the industry, and the forecasts suggest low chances of significant growth in the future. However, these products bring maximum revenue with very low investment to sustain profitability.
In the BCG matrix of Coca-Cola, we can see that Coke has been the market leader in the carbonated soft drink industry and a significant revenue generator for the company. It has a global presence and has been an established brand for years, making Coke a cash cow for the Coca-Cola company.
3.4. Question Marks
Question marks are the products that are still in the development stage, and the market's response to these products is still not very well established. These products initially achieved a small market share, but the investment decision is still risky. So, these products can either turn into stars or cash cows.
In the BCG matrix of Coca-Cola, we can see that they are launching many new brands and lines of products, including Diet Coke. Smartwater, Honest Tea, Sparkling Water, Minute Maid. These products are geared towards growing healthy non-carbonated drinks and healthy lifestyles. Coca-Cola is also investing in new products and raising awareness about these products. These products are question marks for the company.

4. Limitations of BCG Matrix
BCG is a very simple method to assess the position of different brands and products in the market to see where to invest more finances and where there are no chances of growth. However, this over simplicity is a cause of reservation because experts believe many other factors determine the market reaction to any product, e.g., geographical demographics, brand power, competition, etc. So, a decision based on only the BCG matrix is very risky.
It is also observed that the BCG matrix was originally developed for different manufacturing and production units owned by one business group. So, translating this model for different products is out of context. For example, when we use the BCG matrix of Coca-Cola for Coke, Kinley, and Dasani, this is not the proper usage of this model.
Another limitation of the BCG matrix is that it does not consider the gray areas or medium growth and medium market share areas in the real world.
5. Key Takeaways
BCG matrix is a business planning tool that helps companies assess the investment options and the growth potential of their products based on market share and growth predictions. In the Coca-Cola BCG matrix, we can see that Coke is a cash cow but is turning into a dog while the bottled water and healthy lifestyle products are the question marks.
A comprehensive drawing software such as EdrawMax is better for drawing BCG matrices because of the exclusive symbols, clipart, and great tools and layout options. The best thing about EdrawMax is the well-stocked template library that gives you a quick start with professionally designed samples for business planning and analysis diagrams. Find more business diagram templates.
6. References
-
Reading the BCG Growth-Share Matrix. (n.d.). Investopedia. Available at: https://www.investopedia.com/terms/b/bcg.asp (Accessed March 14, 2022).


