How To Create a Funnel Chart
1. Introduction
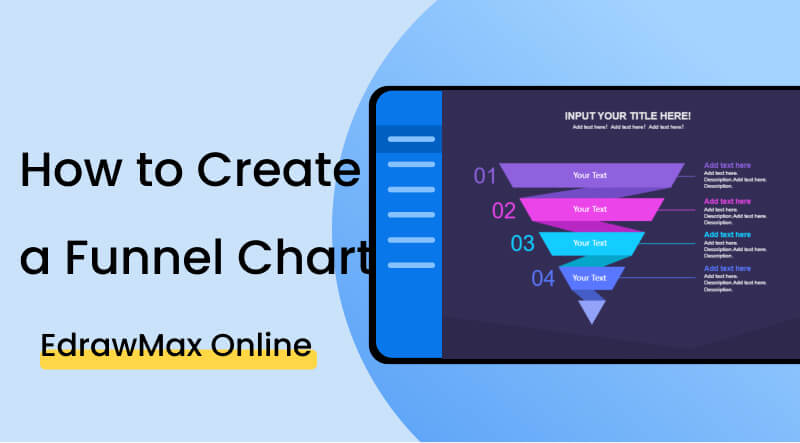
Before you create a funnel chart, it is better to understand its structure and its uses. A funnel chart graphically represents data trends with an inverted triangle or a funnel structure. It doesn’t use any axes to represent data. You can use it to depict regression of data as it moves from one phase to another. It is mostly used to visualize connected sections of a linear process. You can easily create a funnel chart online to depict users' flow in a sales process for any business.

2. How to Create a Funnel Chart
A funnel chart depicts connected stages and a series of data values. They are mostly used in business and sales management. It helps you track the number of visitors that stick with your products or services and those that leave during the process. From this, you can know that the top of a funnel chart is the widest section and contains the highest data values. As you move downwards, data values reduce following each step. You can create a funnel chart with a few basic steps down here.
Step 1. Organize Data
The first step to creating a funnel chart is to organize the data values of the process. Data is going to determine the structure of your chart. If you don't organize it beforehand, you will not know which data values are going in which section of the chart. You can organize data by creating a simple bar chart. The bar chart will help you classify data values based on their perimeters. It will also help you understand the flow of data in the process. Don't forget to use the descending order hierarchy to arrange it.
Step 2. Include Stages
After you are with organizing the data, the next step is to include stages in the funnel. When you add stages, make sure you include at least three stages into your chart. If you don't have enough data values, then you can reorganize them. If you can't add more stages to the plot, it is better not to represent the data using a funnel. In such cases, you can use a pie chart for better understanding.
Step 3. Label each stage
In the next step, you have to give details about each funnel stage by labelling it. The first thing you add is the name of the stage. It makes it easier to understand from the eyes of a reader. The next thing you should add is the number of opportunities or data values in each stage. In a sales funnel, it is essential to add as many details as you can. After that, you have to label the overall conversion rate. It tells the reader the conversion of data values after the reduction of each step.
Step 4. Style the chart
The next step is to style the chart to highlight information on each stage. When you create a funnel chart with more than six stages, it gets a little complex to understand every process of the chart. The best way to avoid that is to style your chart in various ways. You can add different colours for different groups. You can also use data point labels to explain your chart better. If you think your chart lacks clarity, then you can highlight states based on the hierarchy conditions.
If the video doesn't play, please visit it at YouTube.
3. How to Create a Funnel Chart with EdrawMax Online
You can create a funnel chart using the best diagramming software EdrawMax Online. It simplifies every step for you, and you can save a lot of time with its easy to use interface. It comes with many customization options for your chart, and you can use professional templates as the base for your sales funnel. It also comes with a comprehensive library of symbols and templates for you to use. Follow these steps to create a funnel chart online using EdrawMax.
The first thing you will have to do is make an account on EdrawMax Online At the top right, you are going to see a login button. Click on that, and you will be directed to the sign-in screen. Select the 'Create Account' option under the fields.
After you sign in, go to Business>Marketing>Funnel Charts. After that, you can click on it to get a blank canvas. You can start creating the diagram, and you can look for symbols in the symbol library to the left side of the canvas.

You can also look for templates in the EdrawMax Online template library. All you have to do is either go to templates or click the search bar. Type the name of the diagram and get a comprehensive list of templates professionally made for you. You can easily make changes to these templates according to your requirements. Find more templates in Templates Community.

You can customize your funnel chart by using symbols from the library. You have to click and drag the symbols you need and add them to your diagram. You can also add text and change font and styles and text colour. You can add shapes, and there is a toolbar at the top of the canvas with various customization options.

You can save your drawing in all popular formats using EdrawMax Online. All you have to do is go to files and click the save or export options. Please select the format you require, such as docs for a text file or jpeg to export it as an image.

You can create presentations on EdrawMax Online for your project. You can add slides to explain your diagram. You can style every slide differently to make it more creative. 
4. Expert Tips for Creating a Funnel Chart
Tip 1: Bar Funnel Chart
You can create a funnel chart using any style you want, but if you are looking for an easy-to-understand style, go with a bar-style funnel chart. It is like any other funnel chart except for the style of its sections. Instead of using a line to represent the boundary of a section, a bar chart uses area boundaries to separate sections and make things easier for the reader.
Tip 2: Take care of spacing
Make sure to take of spacing between sections of a funnel. You can create a funnel by using an inverted triangle and dividing it into sections. As you know that the width of an inverted triangle shortens as we move from top to bottom, so it is fine this way, but you have to keep the vertical spacing even.
Tip 3: Label carefully
Don't add labels to your cart before you add the funnel and divide it into sections. Make sure to match each label to its represented location. If you don't do that, your chart will become a mess, and even you won't understand it the right way.
5. Key Takeaways
A funnel chart depicts the flow of data values of a process through regression of phases. It is commonly used in sale management to track customers and sales of products. You can create a funnel chart by organizing data and representing it in a reduction hierarchy order using sections of an inverted triangle.
Using EdrawMax Online will help you out a lot when creating funnel charts or any other diagram. It comes with lots of diagramming tools and customization options. You can use symbols and templates and even make slides of your chart using them. It also allows you to export your funnel chart in any popular format. Find more funnel chart templates.


