What is An Infographic - Types, Examples And Tips
Create a Infographic Online Free Free Download Free Download Free Download Free DownloadWhat is an Infographic
That may be an obvious question to start with since most of you must already know what an infographic is. Whatsoever, this is for those who have only a semblance of the idea, and are just looking to know more.
When it comes to the question, “what is an infographic” the answer is simple— it is a visual representation of information that is put together with graphical elements like charts, images, and diagrams, with minimal content that works as an accomplice.
As most of us seem avidly knowledged about this general concept about infographics and their ever so versatile application, many don’t yet still have the presumption of the many more platforms, where an infographic can be used, instead of a bland block of text. So that being the basic, general concept of what it is, let us delve deeper into the ideas of what it can be, that’s it is not already.
There was a time, when diagrams, or any sort of graphical feature, being largely hand illustrations, where a costly affair. Moreover, the concept of illustrations was largely associated with picture books for children and diagrams were more reserved for scientific discoveries and literary anecdotes. But today, dynamic technologies and ideologies largely acknowledge a laissez-aller approach of communication even on official platforms and accounts for the use of fun and interactive infographic, over elementary text. Infographics are about demonstrating it, instead of telling it.
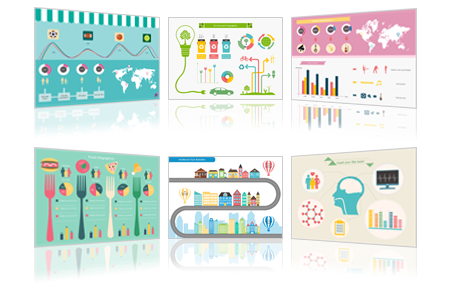
Why Do We Need Infographics
- Information gathered from an infographic is much more comprehensive and snappy.
- It is more attractive than textual paper.
- Communication should effectively provide knowledge and ensure that the audience has a clear understanding of the information. Infographics can help achieve this goal.
- Using infographics makes it easier for the audience to memorize the information
- It takes less time to complete an infographic if you have ready-made templates.
- Data shows that infographic plays an important role in marketing
When To Use Infographics?
With the probability of an easy-to-use and affordable suite like EdrawMax to help you create superior infographics in real-time, there’s probably not much limitation regarding when to use this kind of content. Whereas, the most significant area of application for an infographic is the appropriation of graphical conveyance of information.
There are few contexts when you can’t use an infographic, such as news publications, medical reports, or bank statements. But on a larger scale, using an infographic only makes more sense, since it takes away a lot of weight off grim-looking subjects, such as dissertations or thesis - indeed, dissertations have to be written in a textual format, but the inclusion of infographics at apposite areas, does make the whole document more authoritative and insightful.
Therefore, while infographs are mostly used for business and academic presentations like demographics, business reports or flowcharts, it may be equally used for other more grave contexts that are largely published in a rather undemonstrative manner, such as public sector reports and notices, product manuals, banking guides, and webinars.
Of course, there comes the question of who is to invest so much time and money in making public sector reports so interactive since most of the caliber in invested in the research. That’s where the solution lies as offered by EdrawMax, which makes it easy, affordable and worthwhile.
Another most significant area of application for an infographic is design. It may be designing for the web, product design, or simple applications like timeline, workflow charts, etc. Infographics have become a life force for digital marketing, and all sorts of promotional content, such as brochures, posters or newsletters to social media and blog posts. Finally, it can be a single tool for creating personalized decorative content, such as wedding cards, journals, travelogs. So literally, “sky's the limit”.
Different Types of Infographics
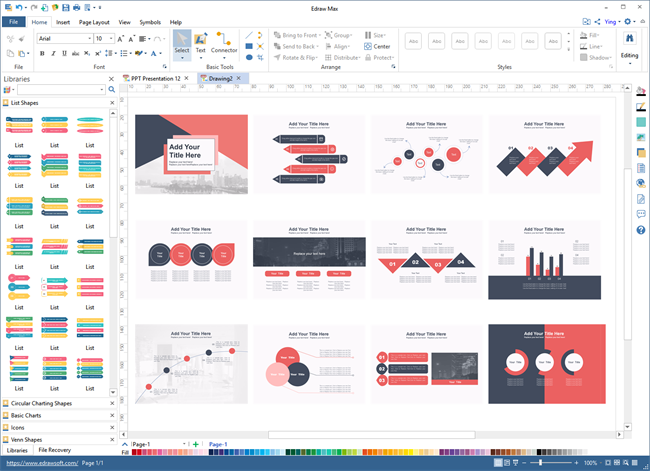
Demographics largely depend on infographic content, to portray populations, statistics, percentage and largely quantitative data. The graphical representation, especially showing a particular population through color blocks, makes up for a more memorable guise.
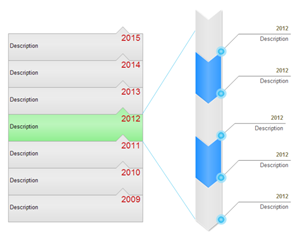
Timelines are about keeping track of time, chronologically, as in a visual record. If much of it is said in the textual format, as an enterprise, one would need a separate management system to keep things in order. Herein, an infographic makes things a lot easier when all the events are coded in simple formats.
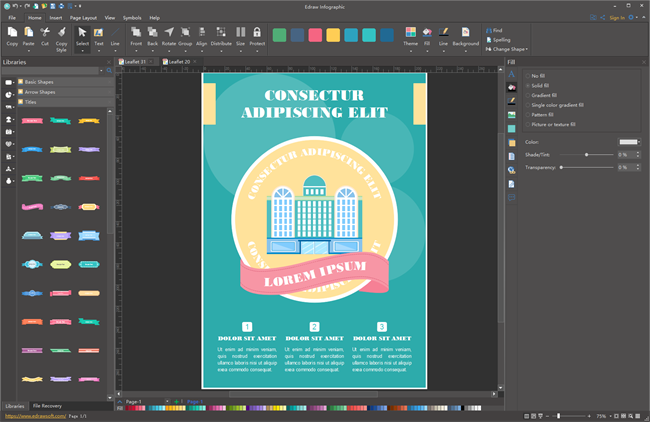
From posters, banners, flyleaf to company brochures, newsletters, and social media posts, you can do a whole more with infographics, in fact, it is used at every step of the way for creating promotional content.
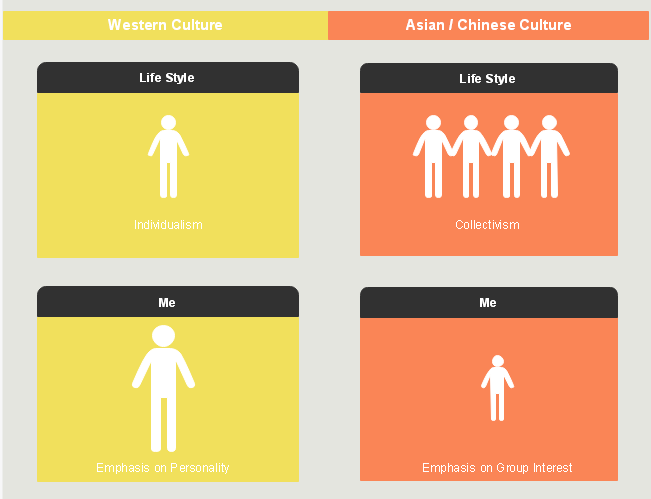
Comparison charts are one of the fundamental types of Infographics, in order to show the comparison between elements, that may be products, then and now, statistical differences and the likes.

From greeting cards to wedding cards, one can make so much out of an infographic with a simple merge of images and text. One may use templates and icons, or even personal pictures for creating decorative, personalized greeting cards for a multitude of occasions and unique way of presenting them.
Infographic Examples in Various Fields
EdrawMax is a powerful tool that lets you use various images and bulk of templates to help you create sophisticated infographics with a professional stance. However, having the tool at hand is only half the job done. The key point that discerns true professionals from a DIYer is the contents. So here are some infographic examples from EdrawMax and you will get inspired by them.
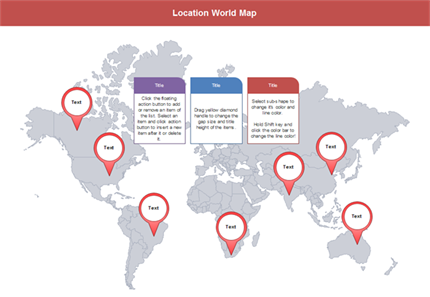
There are so many ways you can point out a map with the help of EdrawMax. No matter it is used for demographics, statistical or showing which locations you are operating. This is a great way to make things simple yet far-reaching.
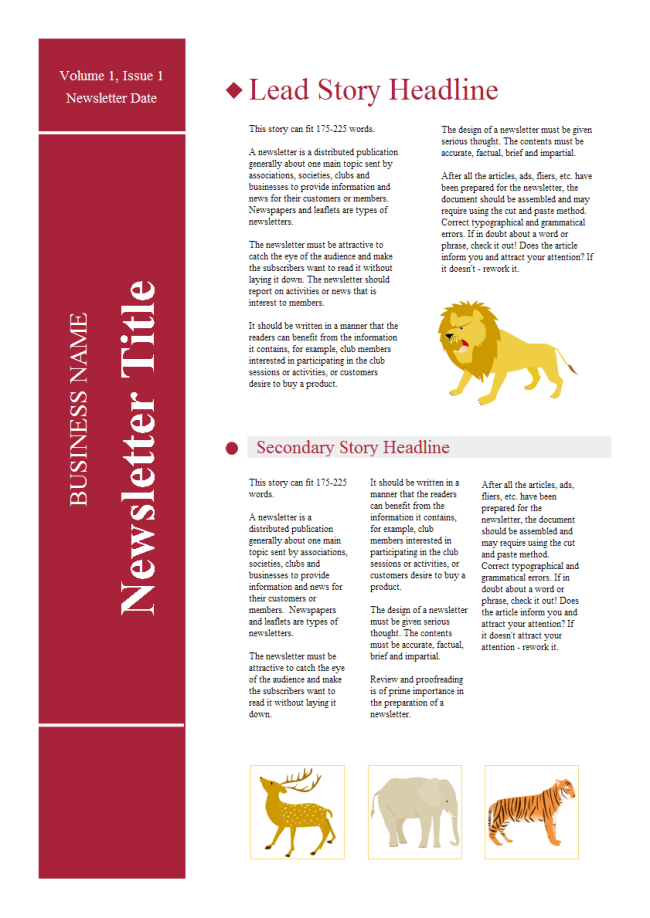
Make impactful newsletters that will connect to your audience. It often matters where and how you share the newsletter, but all in all, as far as the infographic goes, make it astounding with statement color blocks, thematic icons and crisp segregation of the text, that is short and precise.
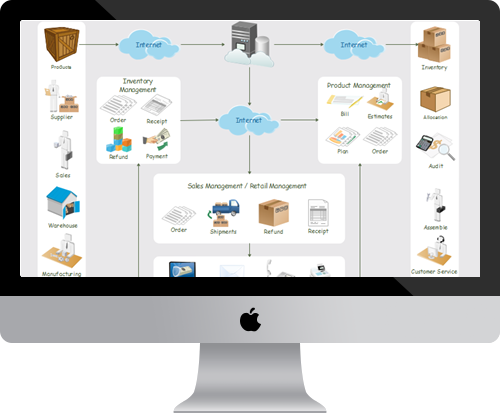
From process lifecycle, the technical methodology to step by step guide, you can use a workflow diagram template for various purposes, that can be real catchy for team members from different backgrounds and departments, and easy to conduct in the long run.
How to Design a Marvelous Infographic With EdrawMax
EdrawMax makes the technical part real easy for a non-professional, and the marvelous part is facilitated by high-quality vector-based icons and templates. You may download the software or use the online version.
Once you have downloaded the suite or log in the online EdrawMax website, you can now open it to your dashboard, which will access you the thousands of elements for your infographics, organized on the left-hand side of the panel. This allows a simple drag-and-drop feature to create the entire infographic modularly.
Tips on Designing an Eye-catching Infographic
- Try to keep it simple. It is usually getting immersive for a designer to add things randomly. However, simplicity is the key to a truly expressive infographic, which is meant for a majority to read.
- Take advantage of contrasting colors. There are many options where different shades of one color may be used. The key is in the right proportion of contrast that can save it from being clusters to definitive.
- Choose an appropriate background. The background holds the entire graphical feature together, that suits the eye and stays consistent. If the background takes away all the attention, then who’s there to see the rest of the show!


