Organizational Chart Complete Guide
Create Your Org Chart NowWhat is an Organizational Chart?
Also known as an org chart or organogram, it provides a detailed visual representation of an organization, key individuals, teams, and the relationship between them. These charts are mostly related to established firms, government sectors, or huge organizations with a complex hierarchy. Ideally, there can be all kinds of org charts, depending on their application and usability.
Mostly, it acts as a useful tool for human resource professionals and corporate analysts. They can easily represent the overall breakdown of an organization, its workload, and identify the key individuals responsible for certain tasks. For instance, you can consider this organizational chart that represents the hierarchical employment flow in a firm.
The Evolution of Organizational Charts
It might sound surprising, but organizational charts have been a part of engineering and management sector for over a century now. The concept was first introduced in 1854 by Daniel McCallum, who was an experienced engineer. While the concept was introduced by McCallum, the first chart was drawn by George Holt Henshaw.
Shortly, all the essential guidelines and theory about the chart was also listed. Though, it took a while for organizational charts to become mainstream. Even till 1920, the concept was not fairly known by professionals. By the same time, Brinton focused on the wide application of the charts and came up with numerous examples to show their applications.
Gradually, they found a way in business and administrative work. In the 1960s, they were known as “organigram” or “organogram”. Today, they have become an evident part of daily professional work in every major organization.
Major Types of Organizational Charts
As stated above, there can be all kinds of organizational charts that we can work on. Before we learn how to make an organization chart, it is important to know their quick classification.
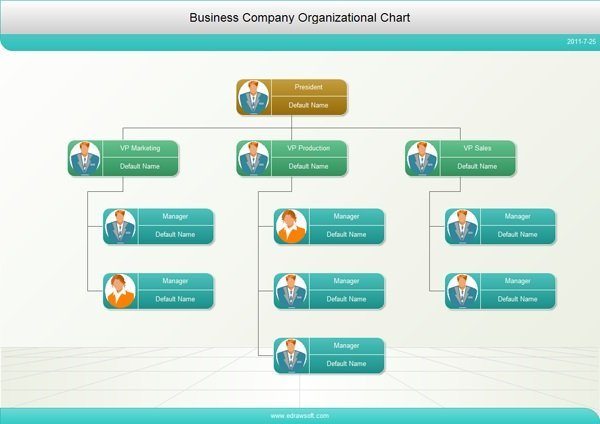
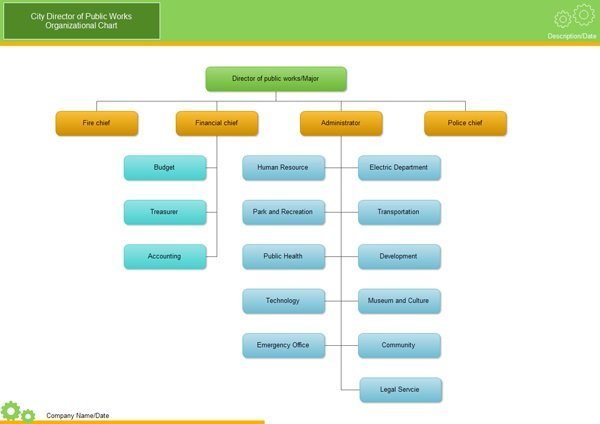
This is the most common and the basic kind of organizational chart that you can create in minutes. It starts with the major root individual or entity. For instance, if we are talking about a company, then it could be the CEO. Now, different departments or groups are drawn from the root. We can create groups on the basis of numerous parameters like employee level, location, the projects they are working on, and so on.
If needed, there could be a relationship between different entities of these hierarchies as well. Though, the relationship between dedicated groups is avoided. These charts follow a top-down approach and are the easiest to make.
A matrix chart overcomes the limitation of a hierarchal chart by depicting a cross-functional relationship. Consider it as a more open and dynamic form of a hierarchal chart. While there are different groups in this as well, entities of these groups can share functions among each other. For instance, if there is an individual under the Marketing group, they can share some responsibilities with the sales team as well.
These diagrams are also helpful in scenarios when individuals have more than one reporting manager. Ideally, it is seen that a matrix chart provides a better real-world representation of an organization’s workflow.
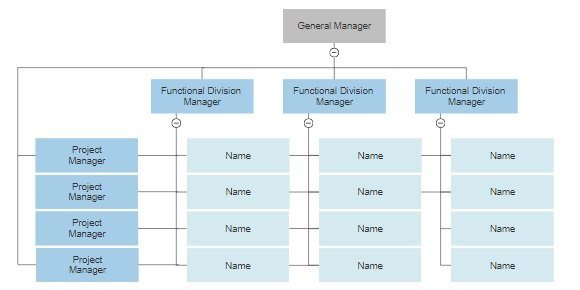
Source: https://wcs.smartdraw.com/organizational-chart/img/matrix-org-chart.png?bn=1510011149
These organizational charts are best suited for workplaces with a horizontal hierarchy instead of an age-old vertical model. They are mostly suited for small or medium scaled organizations in which employees are encouraged to practice self-management. In this, employees are identified in different clusters and they are responsible for their own actions.
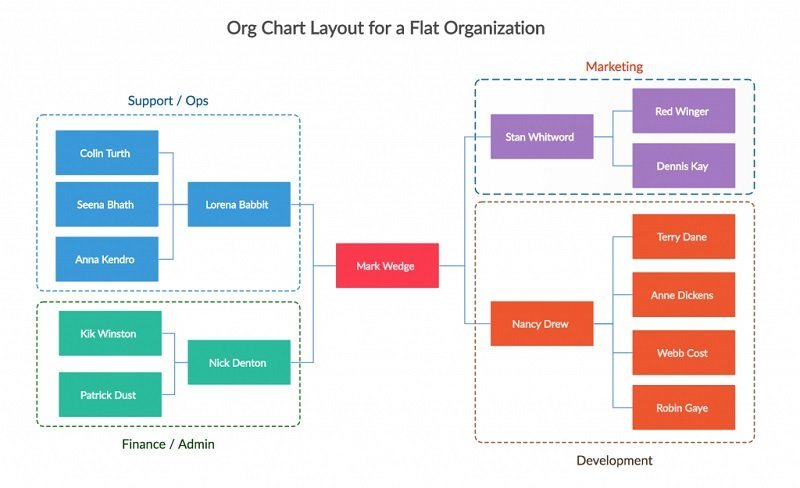
Source: https://creately.com/blog/diagrams/types-of-organizational-charts/
Apart from the above-listed major charts, there could be all kinds of other representations as well. For instance, a network chart simply depicts how every employee is connected to each other with their point of contacts. There could be other kinds of modified charts such as line of organization, team-based organization, division structure, and so on.
Why Organizational Charts are important?
An organizational chart provides an ideal visual representation of the available workforce of any company. It doesn’t matter how big or small the firm is, we can just have a look at the org chart and get to know about its structure. This will help us know about the available verticals, the reporting managers, the total workforce, and numerous other details.
Without an organizational chart, we won’t be able to understand the workflow of a company or any vertical. It also helps us know the responsibilities of employees and how they are connected to each other. From budgeting to work allocation and staffing to employee management, it can be a vital tool in numerous scenarios.
What do we use Org Charts for?
Since organizational charts play such a vital role, they can be used in different ways. Some of their common applications are:
- Most importantly, it can be used to provide the overall organizational structure of a firm. That is the hierarchy of employees at different levels.
- It can be used to depict the overall ownership of management and draw relationships between different individuals.
- It can act as an ideal planning tool and help managers utilize the resources of the available staff.
- A detailed chart of the entire organization can also work as an employee directory and help us find anyone's contact easily.
- It can also be used to depict employee reference, who reports to whom, what are one's key verticals, and so on.
- For HR managers, it can be an ideal tool to calculate details like expenditure, workforce, etc. among different departments.
Limitations of Org Charts
While organizational charts are extremely useful, they also suffer from a few limitations as well.
- They have to be updated frequently, else they become outdated.
- Most of the charts are dedicated to a vertical hierarchy and fails to show a more horizontal management approach (which is becoming popular day by day).
- There is a lack of standard related to org charts. That is, we can use any figure to represent an entity or a relationship.
- They provide a more on-paper formal hierarchy rather than a real-life picture of how the work is done.
- There is a lack of scope to depict a non-linear relationship in these charts.
Organizational Charts Examples
Before we teach you how to make an organization chart on your own, let’s quickly consider some examples to learn more about them.
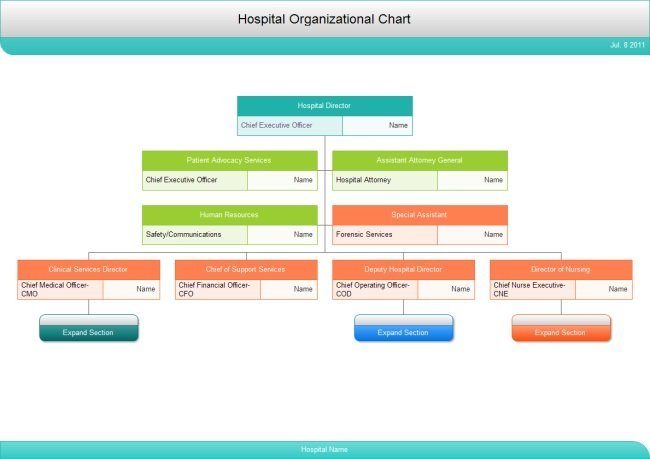
This is a basic organizational chart about the overall hierarchy of a hospital. The director of the hospital acts as the head of the system. The director is supported by the HR team, specialists, and assistants. Apart from that, all the departmental heads also report to the director. We can further expand each department and include numerous verticals, teams, and employees.
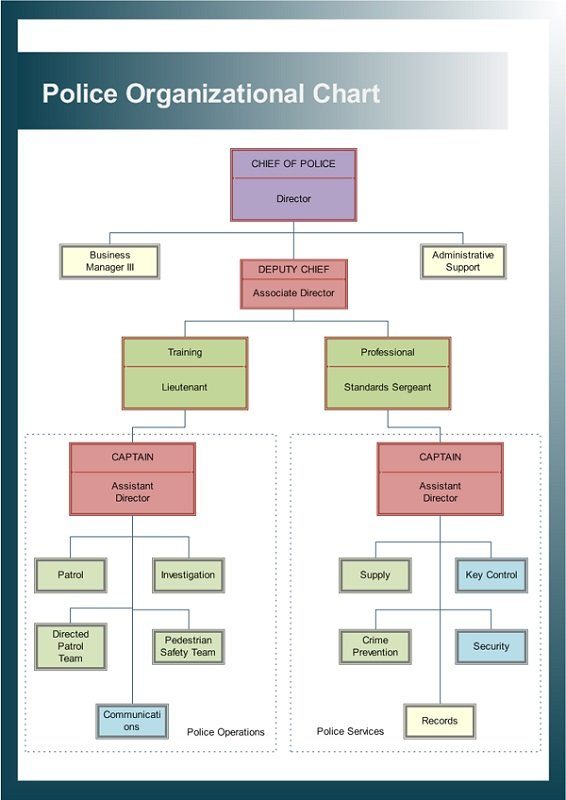
Just like a hospital, the police department of a unit can also have a similar structure. The chief is supported by managers and administrators. A deputy chief reports to the head chief. Furthermore, it can bifurcate into different groups and sectors. We have also included the responsibilities of key members in the group (like a captain) here.
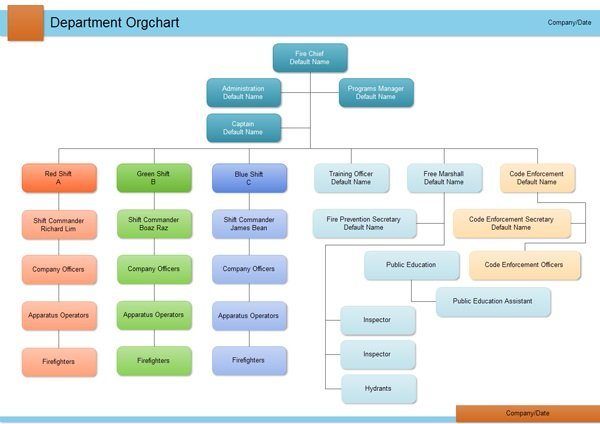
Lastly, let’s have a look at a more complex and hybrid chart. Since it is a general chart, it can depict the hierarchy of any department. The head is assisted by different departments and administrators. Also, the chart depicts employees working in different shifts. Each shift has a manager that reports to the head. Besides that, the chart also represents numerous other verticals and their individual workforce as well.
How to create an organizational chart with EdrawMax?
Now when we have covered the details, let’s quickly learn how to make an organizational chart using an interactive tool.
Before you proceed, make sure that you have the entire employee directory. It is recommended to maintain all the needed information in one place. Mostly, an Excel sheet would do the trick.
Firstly, identify the head of the organization and other individuals/teams that assist the head. Additionally, divide each employee into different groups. Let’s consider that you are dividing them on the basis of their departments.
In the end, just identify how different individuals, groups, or departments are linked to each other. You can link them on the basis of their point of contact, reporting, workflow, etc.
Lastly, take the assistance of EdrawMax, which is a user-friendly tool to create a wide range of charts, graphics, and illustrations. You can start from a blank canvas or use the readily available Organizational Chart template as well.
You can find tons of editing options on each side with your canvas in the center. Simply drag and drop an entity and fill the needed fields. Create different groups and link them together. You can also change the colors, fonts, add pictures, and do so much more using its intuitive interface.
Useful Tips for you to Make a Stunning Org Chart
If you wish to impress your audience by creating engaging organizational charts, then consider following these tips:
- Keep the entire chart on a single page. If you include multiple pages, then it might affect its overall flow.
- Make groups carefully and feel free to relate them together (to draw a hybrid chart).
- Maintain a uniform sense of formatting across the entire chart and at all levels.
- Space all the boxes and groups evenly
- If you wish to depict some assistance, then include a sidebar at any level.
- The job title of an individual comes before their role or description.
- Use both solid and dotted lines to depict the difference in the flow or relationships
- If you are using a tool, then you can always link the charts or add hyperlinks as well.
- Keep individuals who are in the same hierarchy at a uniform level to prevent any confusion.
There you go! I’m sure that after reading this guide, you would be able to know more about an organizational chart and its importance. Not just that, you would also be able to learn how to make an organizational chart like a pro. If you wish to save your time and resources while drafting a professional-looking chart, then use a dedicated tool like EdrawMax. Having tons of features, it will make your job so much easier and will certainly impress others with your skills.


