What is a Process Flowchart: A Useful Guide
Create a Process Flowchart Online Free Free Download Free Download Free Download Free DownloadWhat is the process flowchart?
Any graphical and visual representation of any process related to the business by chart or flowchart is called a process flowchart. It is used to have a clear and systematic understanding regarding how the operation of the company progresses or works, which are the steps that are taken to get a favorable outcome and which are the factors that changed the expected results etc. A business process consists of various stages that are necessary to execute a task successfully. The process flowchart, on the other hand, is just a way to represent the steps visually.
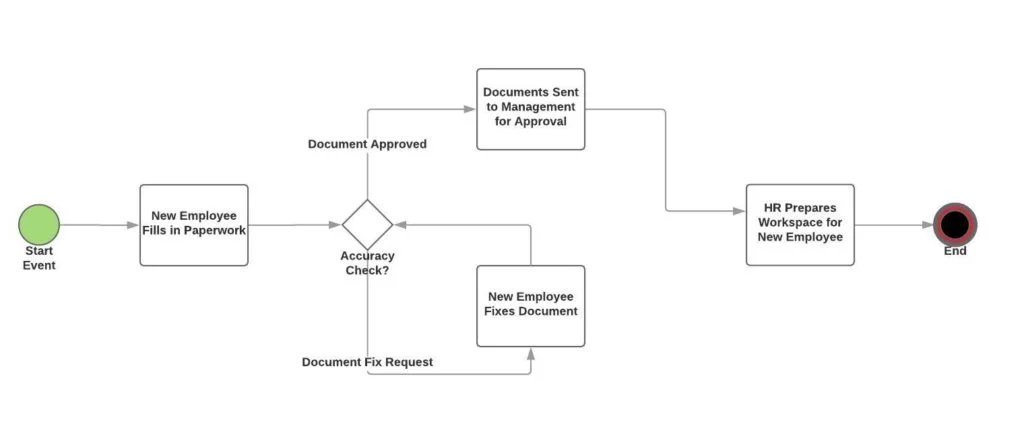
Image Source: tallyfy.com
Why do we need a process flowchart?
Process flowcharts are fundamental representations that can explain the steps that are to be taken to make the business successful. Down below, there are some reasons to use a process flowchart are given.
How does the process happen?
A process flowchart is created and used to understand the basics of any business. A process flowchart can point to several factors that determine the fate and details of the company. Therefore it also helps to cultivate overall knowledge regarding the structure of the business.
- Improvement of the method – After you have gotten an understanding of the process and how it works, you will automatically be savvy about how to improve issues related to the business. For instance, it would be easier for you to create or delete or also rectify some steps of the method. You will be able to completely re-engineer or even change the whole process about how it functions.
- Process Standardization – If you haven’t explained the process to your workers, they will automatically think of various kinds of methods to complete the work. It results in a chaotic situation in the workplace; hence, a process flowchart is very necessary. With that, you can explain the whole process to everyone and they can be on the same level. Thus, doing the work unanimously and in a disciplinary manner.
- Finalizing an operating procedure – A process flowchart is just a simple flowchart, while on the other hand, SOPs are complete wholesome documentation of the functioning of the process and how to carry it out. They also provide details regarding the methods and the tools and techs used. To get a detailed overview, one must follow all the steps necessary, and you can quickly get the best out of their businesses.
When to use process flowcharts:
- To understand the process: A process flowchart helps to understand the basics of any business. It can point to several factors that determine the fate and details of the company. Therefore it also helps to cultivate overall knowledge regarding the structure of the business.
- To improve and rectify: After you have got an understanding of the process and how it works, you will automatically be savvy about how to improve issues related to the business. For instance, it would be easier for you to create, delete or also rectify some steps of the method. You will be able to completely re-engineer or even change the whole process about how it functions.
- To communicate: Lack of communication can result in a chaotic situation in the workplace. To avoid it, you can use flowcharts to get everyone on the same page, which in turn can create an orderly and uniform work environment.
- For documentation: documentation is an integral part of all businesses and its methods. Therefore it is essential to use a flowchart to document the steps of the company.
Commonly used symbols in processed flowcharts:
There are several steps before drawing processed flowcharts. These steps include gathering the necessary information to draw it and to get a wholesome picture of the business. Having a clear vision regarding the company is also a critical factor.
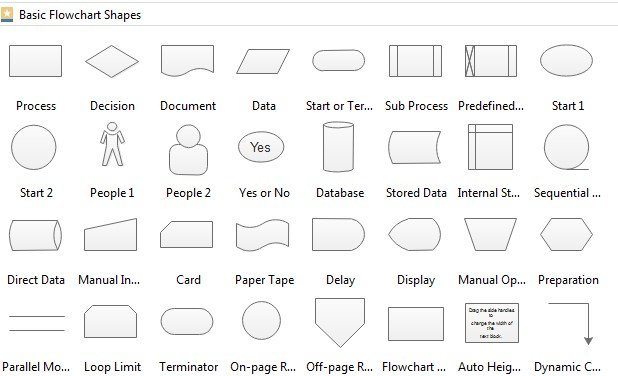
After gathering all the information, you can use some basic symbols to create the process symbols. There are some basic symbols to keep the flowchart simple:
- Rectangle: Action carried by an employee
- Oval: start and endpoint of a process
- Diamond: decision or approval, to make
- Arrow: the connection between various steps
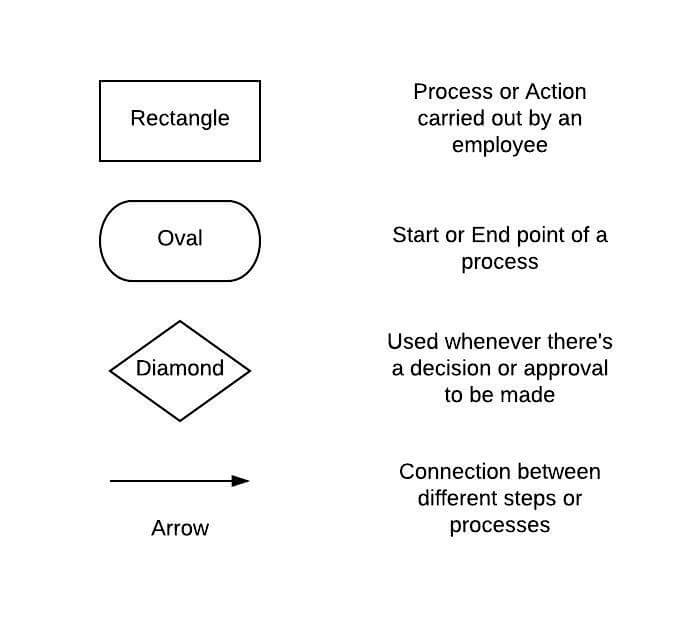
Image Source: tallyfy.com
Learn process flowcharts from examples
It is a critical process flowchart example. Every company recruits new employees. When assigning them to new projects, onboarding is an essential factor to educate them and speed things up regarding how the department works.
So making a process flowchart and showcasing them to the recruits is a vital process which generally happens in some steps. For instance, HR lets them recruit know about his approval, then the department provides him or her with essential tools like computers and software and gives them onboarding essentials and ID.
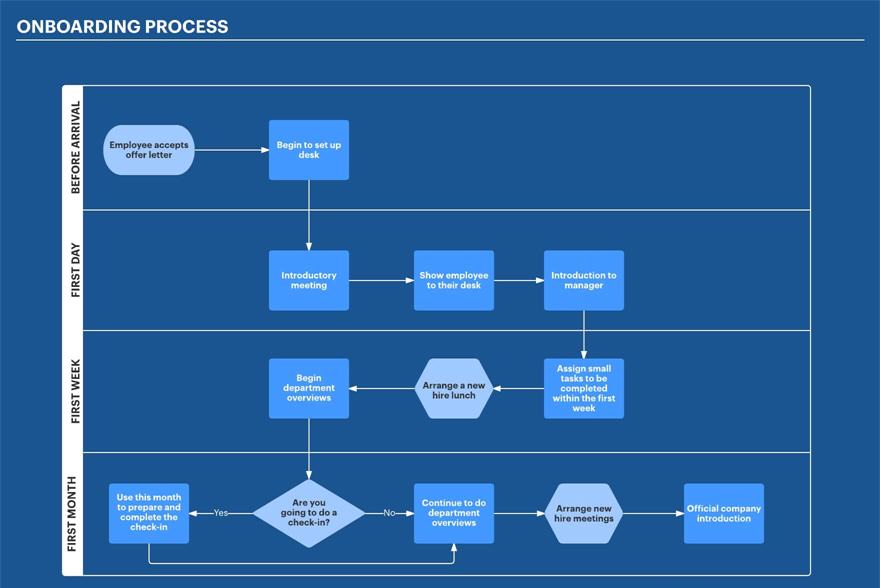
Image Source: cloudfront.net
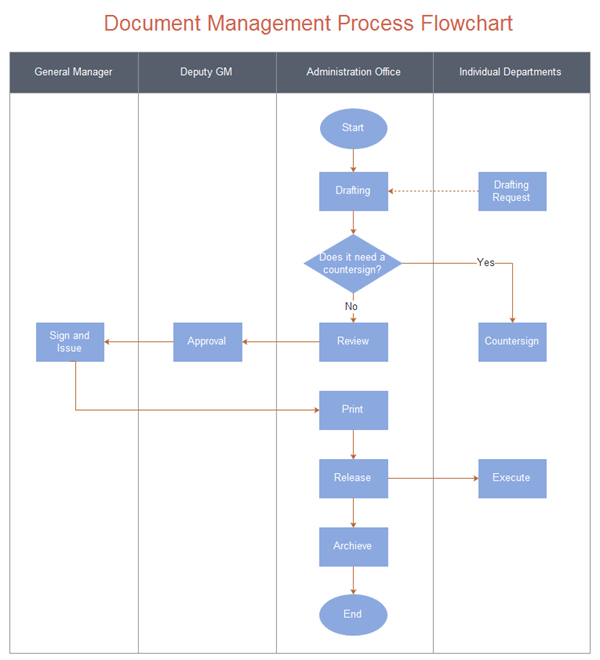
Another process flowchart example is document approval. Correct permissions are critical in all businesses, and these can also be a significant problem. So following a systematic procedure makes it more accessible. The steps are submitting the documents, if approved, terming as relevant, and if disapproved, terming irrelevant sending the email to stakeholders.
A company should always have potential problems detected initially and their solutions ready at hand. Therefore making the process predictable and avoiding any unwanted and unprecedented circumstances. Thus, the company has to make a process flowchart that puts and showcases the steps about potential issues and their possible responses. This way, the worker can also be on the same page with the management and aware of any such incident to tackle it better.
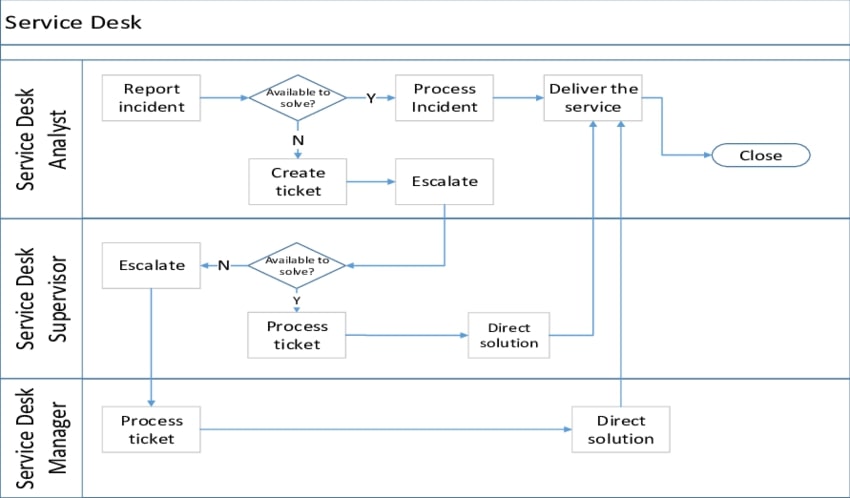
Image Source: researchgate.net
Creating a process flow-chart for dummies
Creating a diagram can become a bit overwhelming, especially in the case of newcomers. Edraw can help you, however there are a few things that you need to take care of beforehand:
- You need to do some research work on the subject on which you are going to create the flowchart. If you have not collected enough data, you can never create a useful diagram on that subject.
- You need to know which template to use and where to find it. Also, you need to be aware of the symbols used while creating one.
- Below are a few parameters that are necessary to take into account while creating a flowchart:
- You need to correctly define your process boundaries by establishing starting and ending points;
- You have to keep in mind what it is that you want to do with the flowchart you are creating. In other words, keep track of the bigger picture;
- Each step needs to be defined clearly and accurately;
- Keep track of the time lags as well as the non-value-adding steps while creating the flowchart;
- The best practice is to share or circulate the flowchart among every member involved in the project. You never know what comment might come in handy.
So, with that cleared up, let us move onto creating a flowchart.
Step 1: The first and foremost thing you need to do is open a new drawing page or template. Follow the below process:
File Menu > New > Engineering > Process Flow Diagram (double-click to open)
Step 2: Start creating the flowchart by dragging equipment shapes or flowchart symbols onto the drawing area. You can do it from the Equipment group in the library panel at the left side of the canvas.
Step 3: Now that you have dragged all the equipment you need onto the drawing page, you need to connect them to create the flow of the process. To do so, you need to again drag a pipeline onto the canvas area. You can find them at the Connection Shape group.
Step 4: After you drag in the pipeline, position one of its endpoints with the required equipment shape. At first, the connection point will appear blue in color on the equipment shape. Once fixed, the color will change to red.
You can also use the Connection Point Tool to do the whole task from the Home Tab.
Step 5: Drag and fix all the other pipeline endpoints in the required order and with the correct equipment shape.
Step 6: You can edit the pipeline style from the Line Button under the Home Tab. In case you need to add an arrowhead or weight at some point in the whole process.
Step 7: In much the same way, i.e., from the Library Menu, you can add values as well as instruments to your flowchart to make it more accurate and comprehensible.
Step 8: There is a rotation handle on every equipment shape that lets you rotate that particular shape.
Note: You can also reposition by dragging the equipment shape to your desired place. Also, if you want to add any extra data or text you can do so by double clicking on a component.
Tips to make an effective process flowchart
- Design elements: You should use consistent design elements that include the lines, texts, and shapes. Using consistent details can be very efficient, easy to follow, and effectively eliminates any unwanted distractions.
- Using a single page: Keeping the total content of one process flowchart on one page is very convenient to follow and easy to understand.
- LEFT TO RIGHT: Frowned upon is the way to represent the data flow is from left to right. It also makes it very convenient for the audience.


