How to Create an Organizational Chart in PowerPoint
1. What Is the Organizational Chart
An organizational chart is a hierarchy diagram that uses general visuals to represent a broad-based overview of a company's structure. Furthermore, the charts highlight employees' job posts, responsibilities, and related departments. It helps the management team to connect the employees and themselves. As for the tools, there are a lot of programs to generate ideal organizational diagrams that serve the purpose.
2. How to Create an Organizational Chart in PowerPoint
The most basic program for organizational chart production is Microsoft Office Powerpoint. It requires minimum effort and designing skills. Yet, PowerPoint is not the best option if you are looking for a detailed and excessively customized organizational chart. The five simple steps that will depict how to create an organizational chart in PowerPoint are as follows.
Step 1:Registering And Creating The File
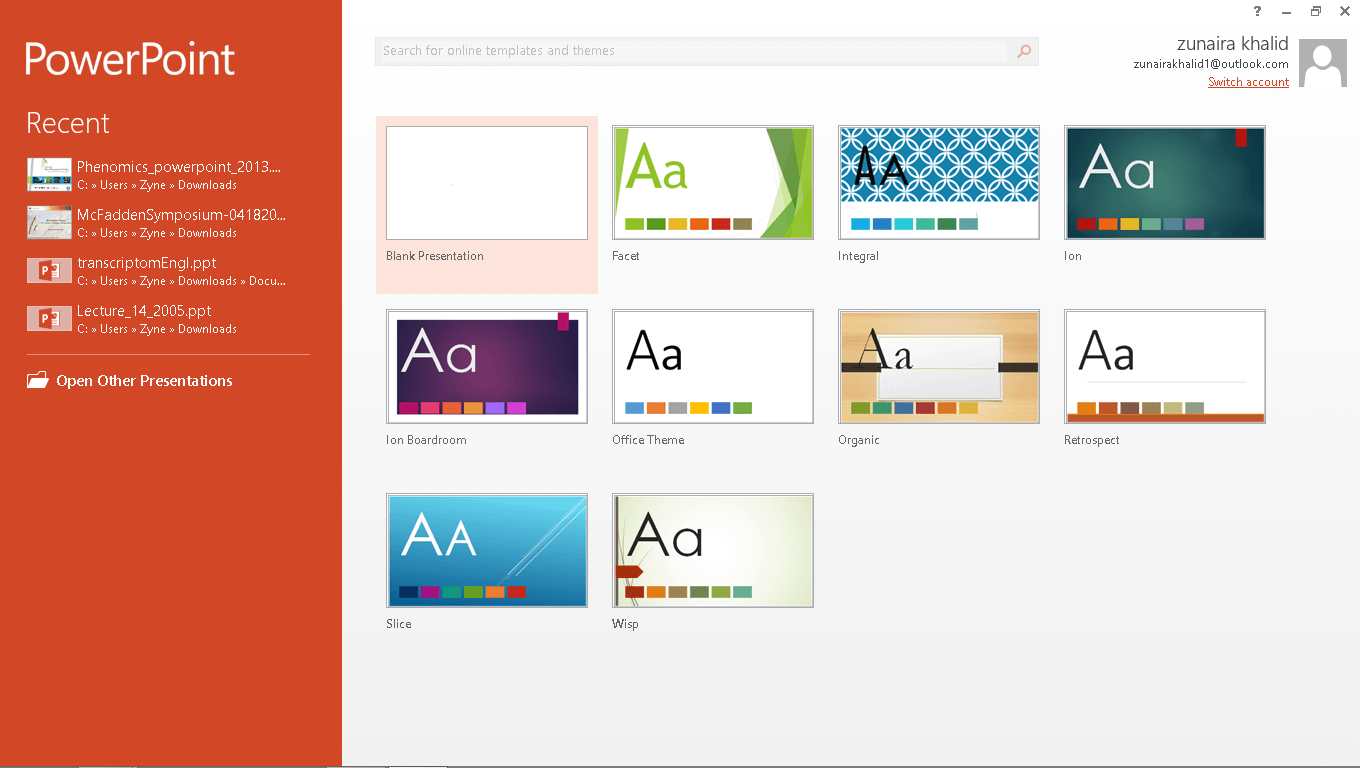
Microsoft Office is not a free program. You'll have to pay to avail it. After successfully purchasing the software, register yourself and open the Microsoft PowerPoint. It has a primary interface with simple icons. Click “Blank Presentation” to create a new ppt file for the org chart canvas.
Step 2: Inserting the Template
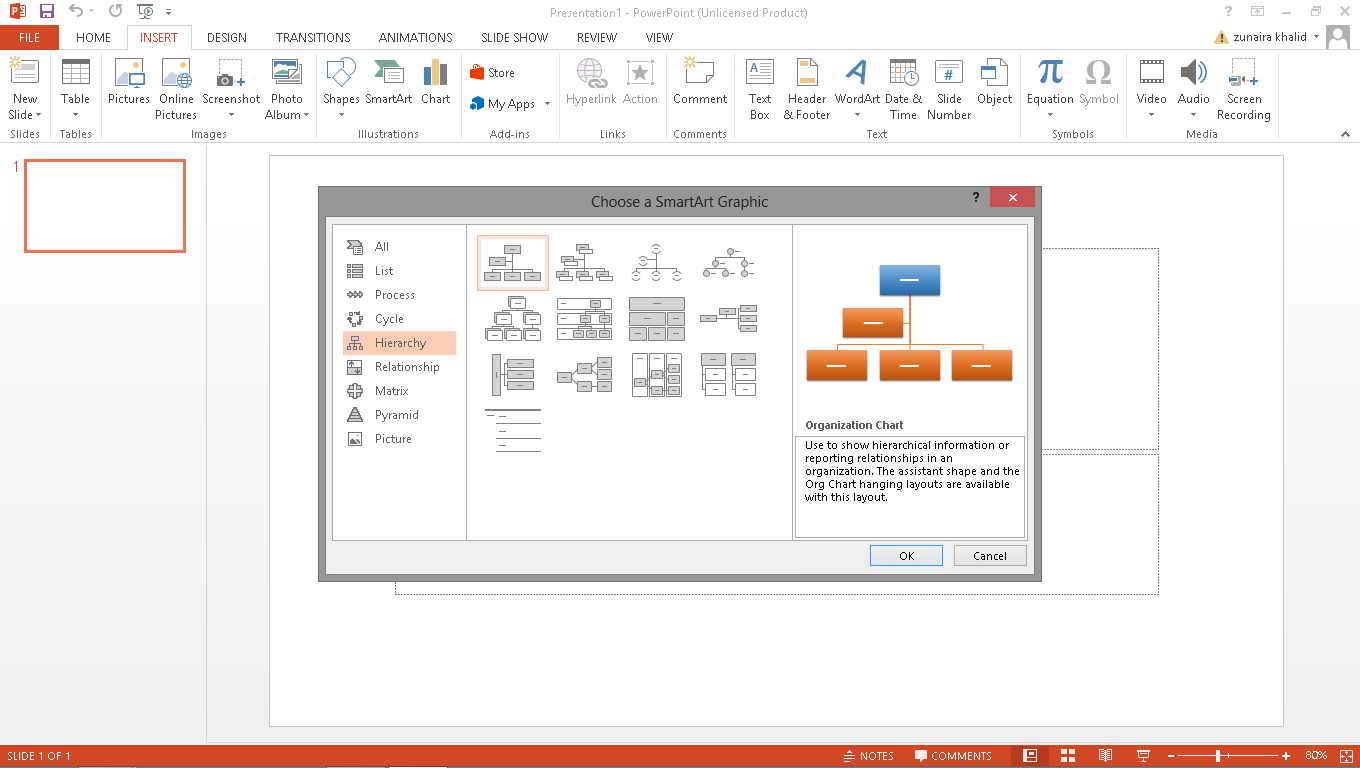
Once you get the specific canvas, head to the “Insert” button in the top left and click on it. You'll see several options in there. Find the “SmartArt” button and click it for template box. Once the dialogue box appears, find the “Hierarchy” option and select an organizational diagram layout. Choose the layout and click “Ok” to transfer the layout to your edit screen.
Step 3: Adding Text And Moving The Components
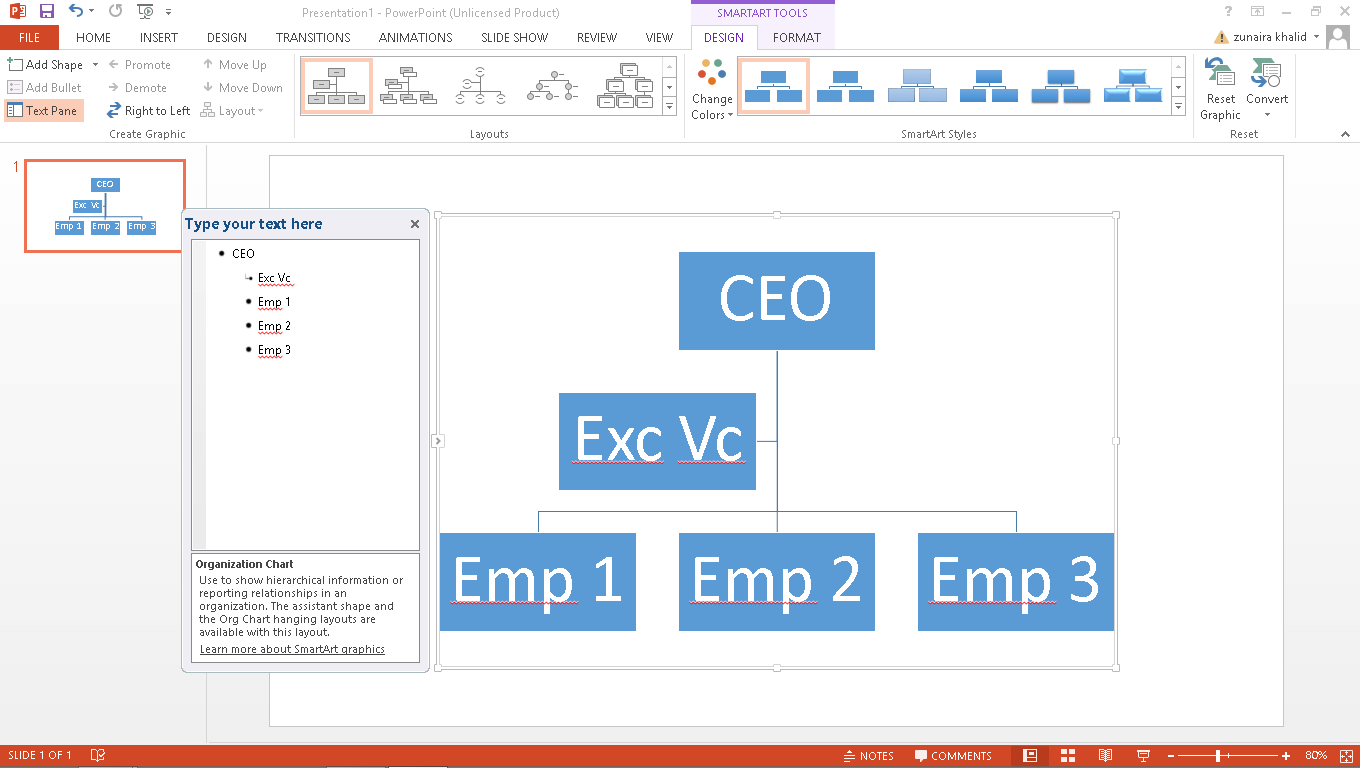
Once you get the layout onto the edit interface, add text by choosing the appropriate box. Add more shapes using the shape section on the top bar. On the top left, find the “Add Shape.” Click and add the component inside the layout. Moreover, you can move them across the screen as suitable. Click on the “Move” buttons to shift them vertically and use the “Promote” and “Demote” buttons to move them horizontally.
Step 4: Customizing Your Layout
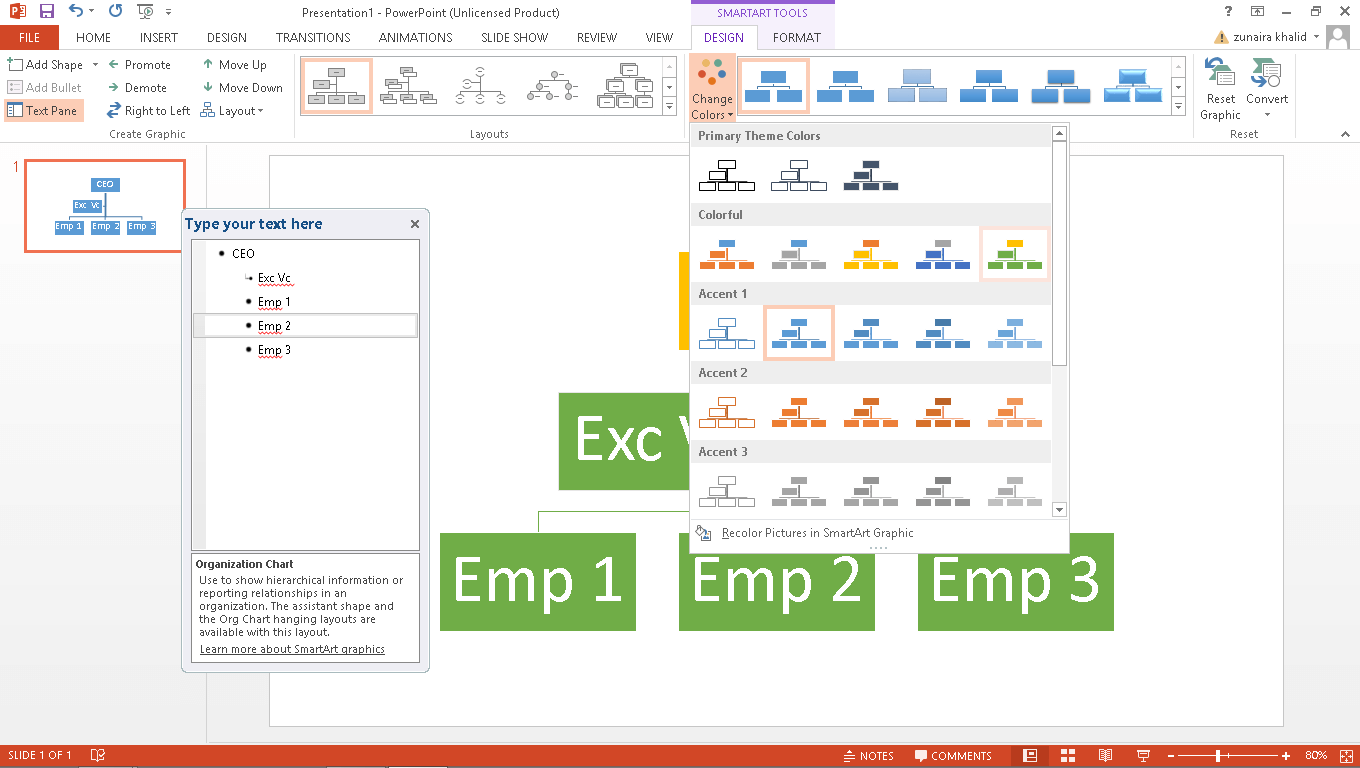
Once you are satisfied with the layout sequence, customize it as you like. You can change the box's color, text font, color, and size. By clicking on the layout, you'll find a sequenced section on the right that can help you to use the color scheme as the organization levels. Use the “Design” button to explore more customizing options in the PowerPoint.
Step 5: Save And Export
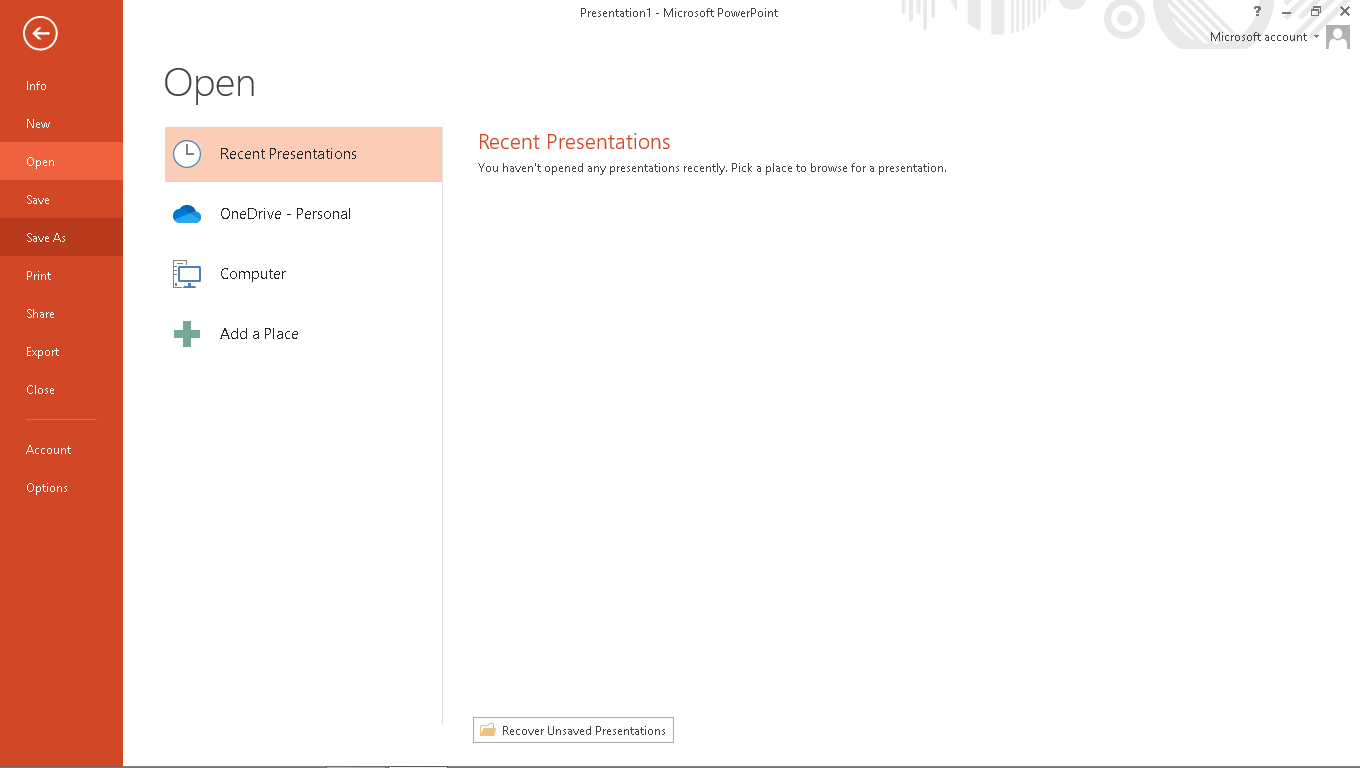
Once you get the final product, click on the “File” option on the top. Next, click “Save As” on the left to export the file. Microsoft PowerPoint allows you to export the file in more than one format. You can use different file formats like Pdfs to save and use the chart on different social platforms.
3. How to Create an Organizational Chart Online Easier?
The previous overview shows us how to create an organizational chart in PowerPoint. However, Microsoft Office PowerPoint is unsuitable for every type of org chart. For that reason, we jump onto the different programs offering more services than a PowerPoint presentation toolkit. Creating an organizational diagram is much easier in EdrawMax, all thanks to its user-friendly interface. With a minimum amount of time, you can yield maximum value out of the program with simple steps.
Step 1: Open EdrawMax Online and login
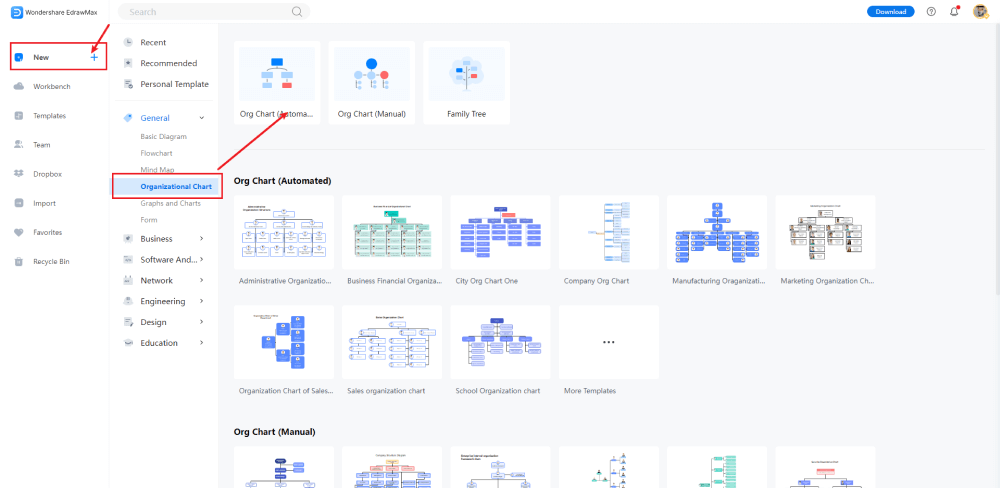
Open your browser and head over to the search engine. Type “EdrawMax” inside and open the EdrawMax Online official link. Once you are inside the home screen interface, find the “New” option and click on it. Now form the pre-loaded layout, find the “Org Chart,” and click on it to transfer it to the edit screen. You can create different layouts according to the design and details on the edit screen. At the left middle of the screen, you'll find different components helpful to recreate the entire layout or its specific components.
Step 2: Template Selection
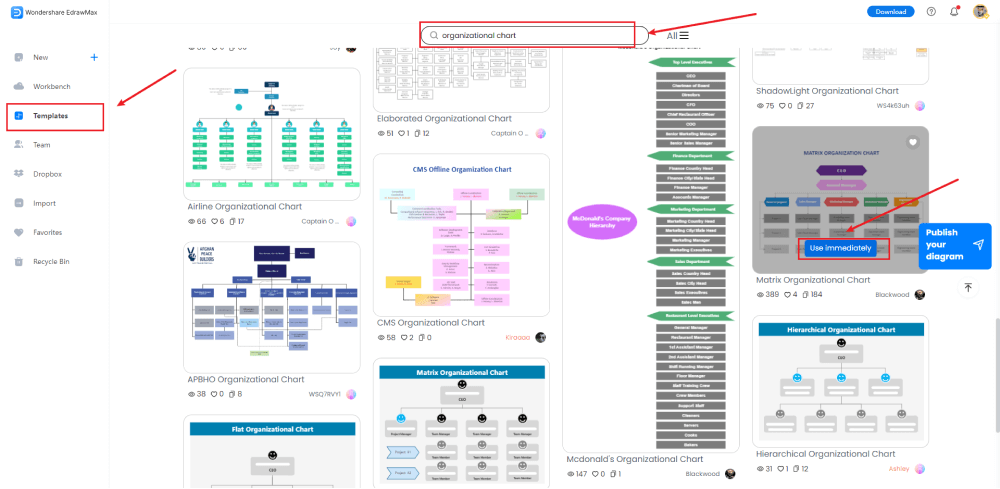
You can choose the template option if you do not want to spend a lot of time recreating the entire chart from scratch and editing every minor detail. EdrawMax has a massive social community that shares templates in a network daily. To open the template channel, find the bar button named “Templates” on the left and click it. You'll reach an interface with a search box on the top. Write Organizational Chart in the box and find the template you want to use. Once you find one, hover the cursor over it and click the “Use immediately” button to start the editing.
Step 3: Customize the Template
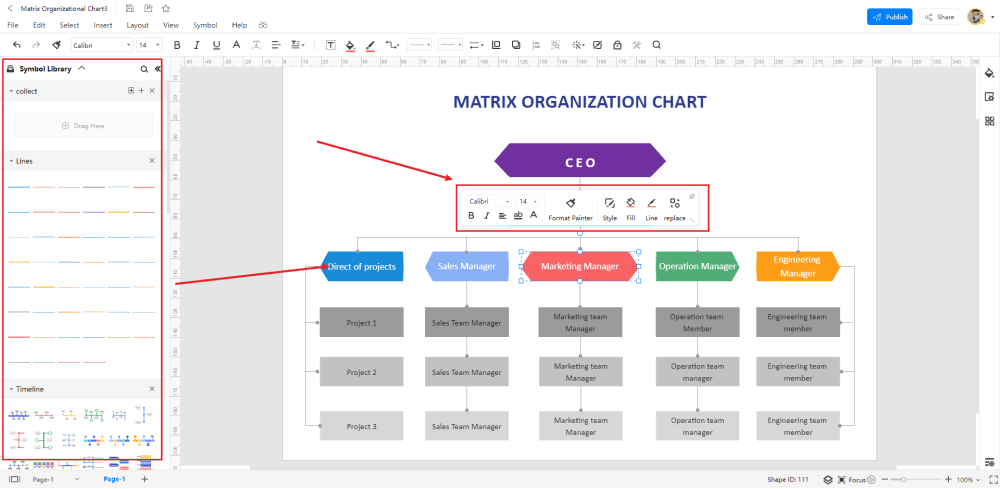
Customization is the key to making the chart engaging and understandable. It makes the chart well connected to the elements. Edrawmax has a massive set of tools useful for any type of editing and customization. The diverse customer exposure allows you to add, remove, or replace the images and cliparts. Plus, you can customize every type of shape and text color. You can change the entire template with a few clicks into a better-specified version suitable for your company.
Step 4: Export or Share
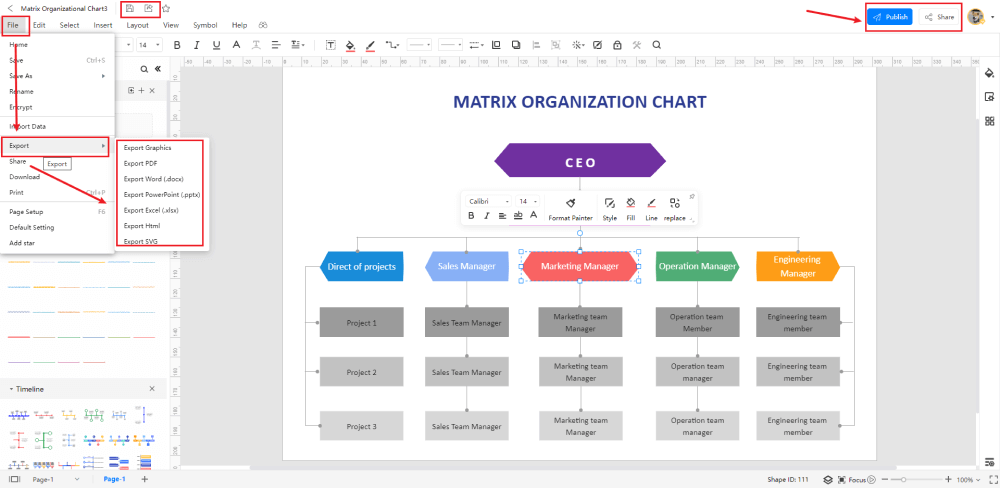
After the completion, once your end-product is ready, export it inside your computer storage in 14 different formats. For that, head over to the file option and click “Save As” to browse the location of your file. You can choose any format optimum for your sharing standards. Moreover, you can share your template version with the community using the “Publish” button in the top right corner. Click on it, name your template, and click “Ok” to publish the chart.
4.EdrawMax VS PowerPoint
PowerPoint is an excellent source for generating a presentation. However, it isn't much effective in producing a well-detailed and sequenced, physically appealing organizer. There is no doubt that it can serve the purpose at least. However, if you want something extra and better to help you organize the internal structure in minimum time with less effort, PowerPoint is not the option for you.
On the other hand, EdrawMax strikes better with its unique and better customer experience. The first thing that Powerpoint misses is the diversity of templates. There aren't many templates left to choose from. You have limited options in it. In contrast, look at the template community of EdrawMax, where you'll find thousands of options that keep increasing daily.
5. Online Organizational Chart Maker
Organizational chart makers are not easy to find in the market. Especially, the ones that provide value for free. For that reason, we are ending your search here with a credible option—EdrawMax Online. It is an organizational chart maker that isn't completely free. You will have to pay for some premium features. Yet, its 15 days free trial is enough for you to experience what you are missing.
- EdrawMax uses the easiest interface that plays a vital role in better customer communication throughout the program.
- The large template community offers you a diverse approach to numerous readymade charts that make the designing more fun and easier.
- EdrawMax offers huge customization perks to its users. You can not only customize but add free visual art in just a click.
- EdrawMax lets you customize every template part that can help you transform the chart according to your desire.
- The organizational chart production is much easier in EdarwMax. Therefore, its users only require basic design knowledge to work on it.
- EdrawMax supplies fifty thousand symbols to the customers. Plus, there are a lot of ready-made elements that can help you save time and effort. On top of that, you can create your symbols and save them to use later.
6. Key Takeaways
Making organizational charts are possible in the PowerPoint but it is mainly a presentation software. So, experts suggest EdrawMax as a better alternative to PowerPoint in terms of organizational chats. Both can create an exceptional organizational chart that uses the hierarchical model to depict the sequence of management committees and the company's internal structure. However, EdrawMax does all that in a better and quick way.
The accessible user interface, optional templates, extreme customization, and easy handling make it the best option for designing any visualization, especially organizational charts. Furthermore, the better customer service and template community aid the users in every way so they can extract the maximum value out of the software. Why spend hours getting a chart when one can get it for free? Try it yourself and find how easy it is to make a functional visualization by downloading it for free!


